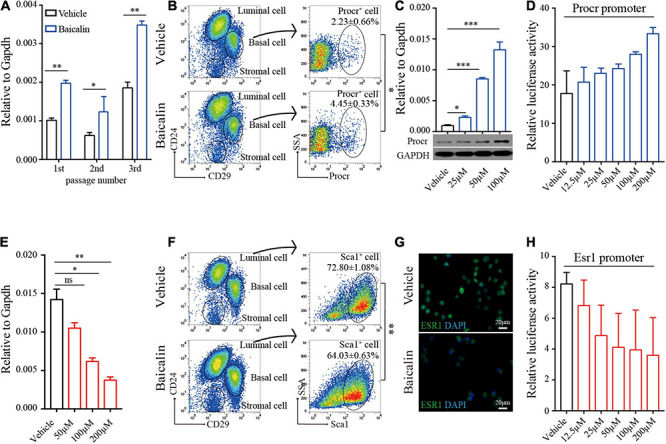
FIGURE 4.

Baicalin up-regulates Procr expression and down-regulates Esr1 expression. (A) RT-qPCR analyses were performed to detect Procr expression in basal cells after different numbers of serial passages. Data are presented as mean ± SD from three independent experiments. Student’s t-test: **P < 0.01; *P < 0.05. (B) FACS of mammary epithelial cells to determine the percentage of Procr + basal cells in C57BL/6 mice. Student’s t-test: *P < 0.05. (C) RT-qPCR and western blot analyses were performed to detect Procr expression in primary cells treated with baicalin. Data are presented as mean ± SD from three independent experiments. Student’s t-test: ***P < 0.001; *P < 0.05. (D) Luciferase assays of Procr promoter activity. Data are presented as mean ± SD from three independent experiments. (E) RT-qPCR analyses were performed to detect Esr1 expression in luminal cells. Data are presented as mean ± SD from three independent experiments. Student’s t-test: **P < 0.01; *P < 0.05; ns, not significant. (F) FACS of mammary epithelial cells to determine the percentage of Sca1+ luminal cells in C57BL/6 mice. Student’s t-test: **P < 0.01. (G) Immunostaining images of ESR1 protein in ZR-75-1 cells upon treatment with baicalin. Scale bar, 20 μm. (H) Luciferase assays of Esr1 promoter activity. Data are presented as mean ± SD from three independent experiments.
