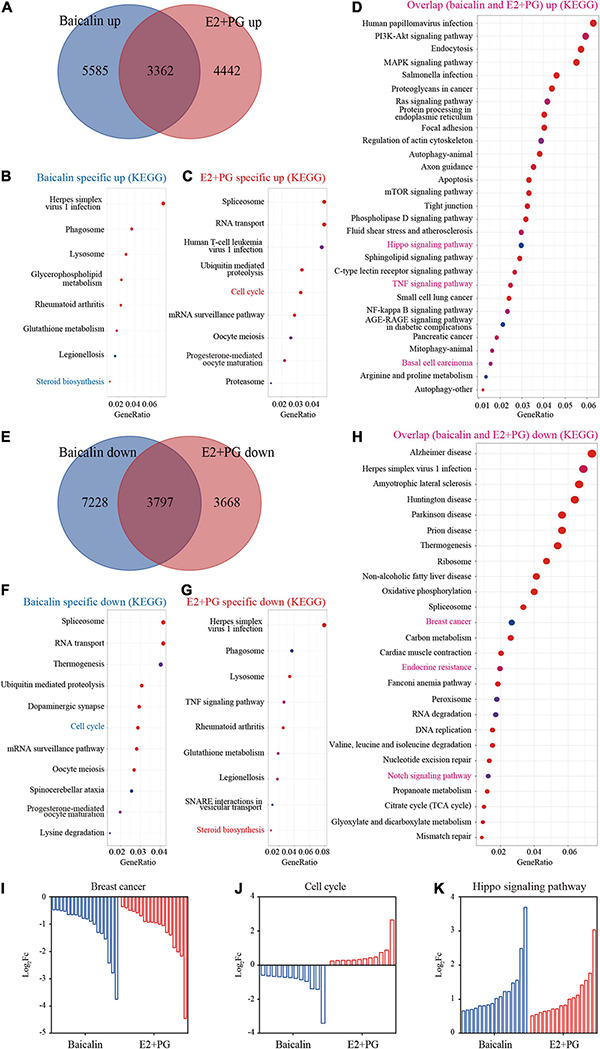
FIGURE 6.

Transcriptome analysis of luminal cells treated with baicalin or E2 + PG. (A) Venn diagram showing the overlap of genes up-regulated in 3D-cultured luminal cells treated with baicalin or E2 + PG. (B,C) Enriched pathways from KEGG analysis of genes up-regulated in luminal cells treated with baicalin (B) and E2 + PG (C). (D) Enriched pathways from KEGG analysis of genes in luminal cells up-regulated by both baicalin and E2 + PG. (E) Venn diagram showing the overlap of genes down-regulated in 3D-cultured luminal cells treated with baicalin or E2 + PG. (F,G) Enriched pathways from KEGG analysis of genes down-regulated in luminal cells treated with baicalin (F) and E2 + PG (G). (H) Enriched pathways from KEGG analysis of genes in luminal cells down-regulated by both baicalin and E2 + PG. (I) Representative pathway (breast cancer) down-regulated by baicalin and E2 + PG. (J) Representative pathway (cell cycle) down-regulated in luminal cells by baicalin, but up-regulated in luminal cells by E2 + PG. (K) Representative pathway (Hippo pathway) up-regulated in luminal cells by baicalin and E2 + PG.
