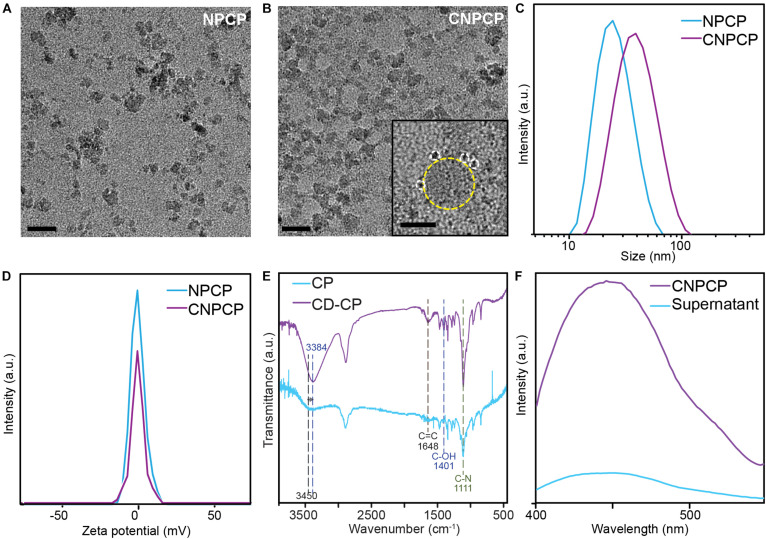
FIGURE 3.
Physicochemical characterization of NPCP and CNPCPs. TEM images of (A) NPCP (synthesized without CD-CP), and (B) CNPCPs. CDs (circled with white dashed circle) can be found surrounding the iron oxide core of CNPCP (yellow) (inset). Scale bar = 20 nm, 5 nm in inset) (C) Hydrodynamic sizes and (D) zeta potentials of NPCP and CNPCP. (E) FTIR spectra of CD-CP and CP. (F) Fluorescence emission of CNPCP solution before (CNPCP) and after (supernatant) magnetic separation of CNPCP from the solution.

