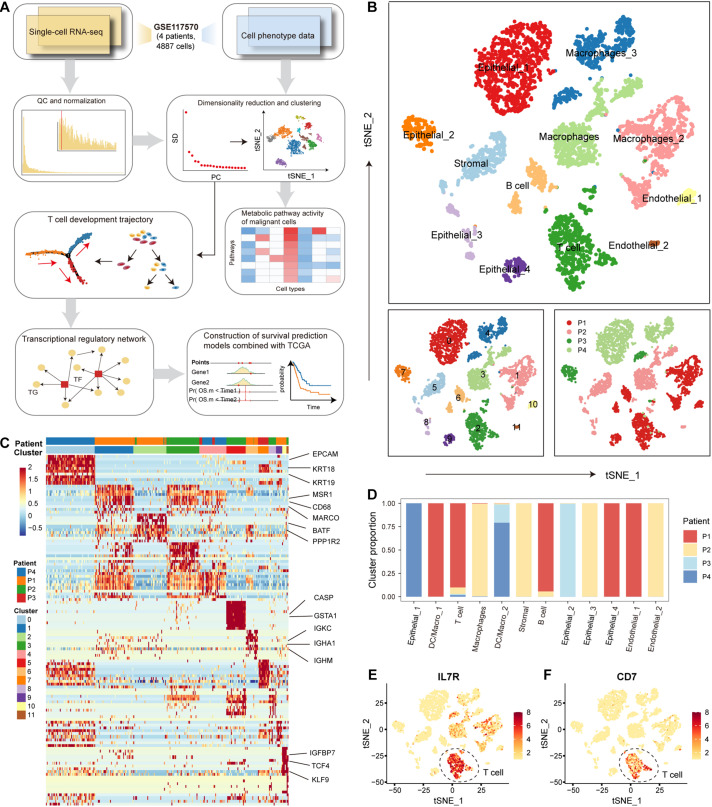
FIGURE 1.
The cellular landscape of non-small cell lung cancer (NSCLC). (A) Workflow diagram representing the pipeline for scRNA-seq data analysis. (B) Tumor cells were clustered by the t-SNE clustering algorithm into 12 clusters with a specific color marker. (C) Heatmap of differentially expressed genes in each cluster. Expression levels of the top 30 genes (rows) that are differentially expressed in each cluster (column). Marker genes in each cluster were annotated. (D) Bar plot of the origin of the cells in each cell type. The horizontal axis is the 12 cell types, and the vertical axis is the proportion of cells. (E) Distribution of IL7 gene expression in all tumor cells. The higher the gene expression, the darker the color. (F) Same as in (E) but for the distribution of gene CD7.

