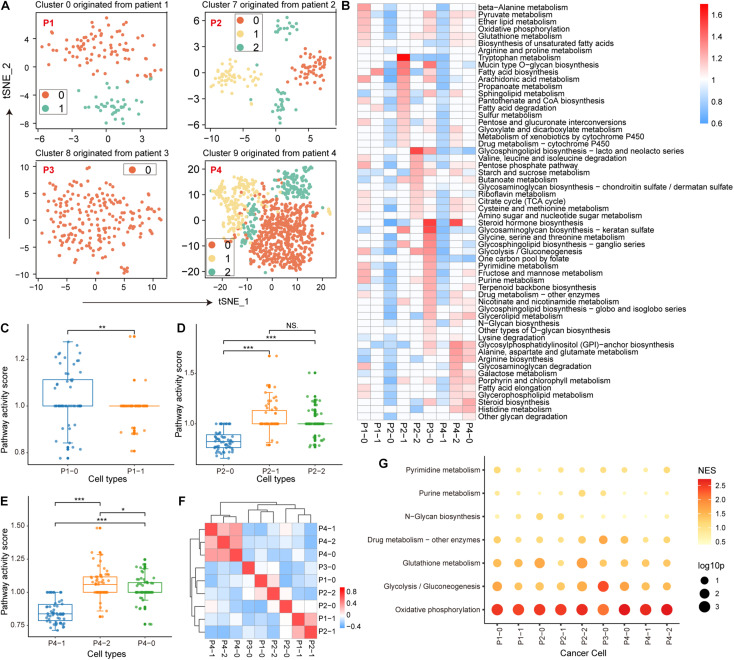
FIGURE 2.
Metabolic features of malignant epithelial cells. (A) Four clusters of malignant epithelial cells originating from four patients with non-small cell lung cancer (NSCLC) were individually re-clustered using t-SNE. (B) Metabolic pathway activity in each cell cluster. Values with statistically non-significant pathway activity (random permutation test, p > 0.05) were shown as blank. (C–E) Boxplot of pathway activity scores of malignant cell clusters originating from patients 1, 2, and 4. (F) Correlation of each malignant cell cluster in metabolic pathway activity scores. Additionally, ∗p < 0.05, ∗∗p < 0.01, ∗∗∗p < 0.001. (G) Enrichment results of metabolic pathways in variant genes using gene set enrichment analysis (GSEA). The size of the bubbles represents statistical significance and the shade of the color represents the normalized enrichment score (NES).

