FIGURE 3.
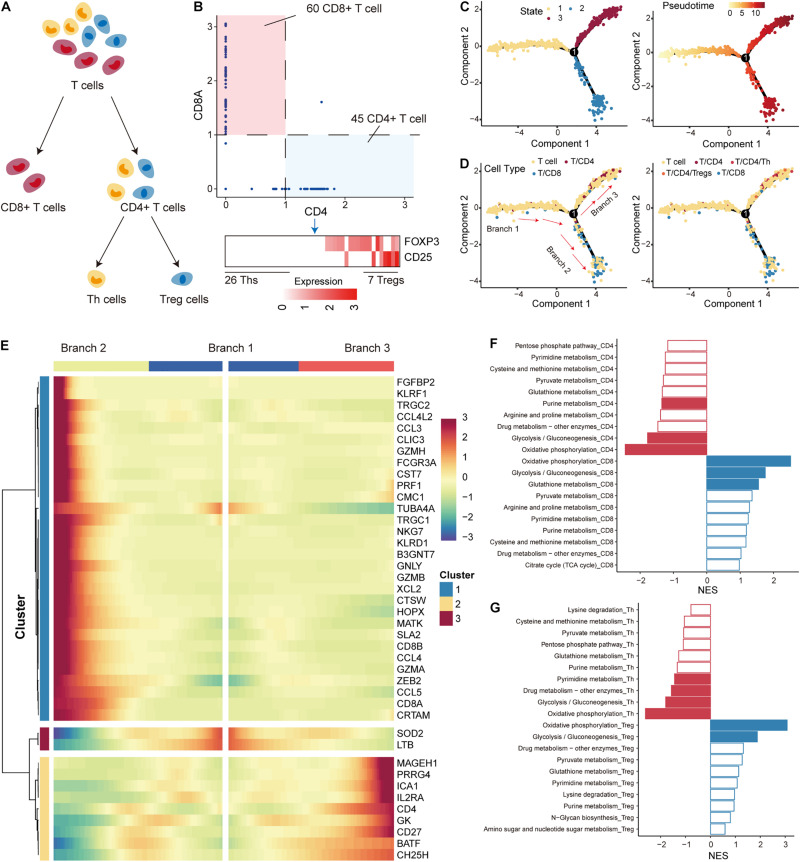
Differentiation trajectory and metabolic features of T cells. (A) The panel shows the differentiation process of T cells; T cells were divided into CD4+ T, CD8+ T, Th, and Treg cells. (B) Expression levels of marker genes (including CD4, CD8A, FOXP3, and CD25) were used to separate T-cell subtypes in non-small cell lung cancer (NSCLC). (C) The pseudo-time trajectory of T-cell differentiation. Each point represents a cell and is marked with the cell state (left) and pseudo-time (right). (D) Same as in (C) but for cells marked with T-cell subtypes. (E) The heatmap shows the branch-dependent genes at branch point 1. The center of the heatmap is branch B1, the left is B2, and the right is B3. (F) Top 10 metabolic pathways enriched in CD4+ or CD8+ T cells. Significantly enriched pathways with gene set enrichment analysis (GSEA) p-values < 0.05 are highlighted in red (CD4) or blue (CD8). (G) Top 10 metabolic pathways enriched in Th or Treg cells. Significantly enriched pathways with GSEA p-values < 0.05 are highlighted in red (Th) or blue (Treg).

