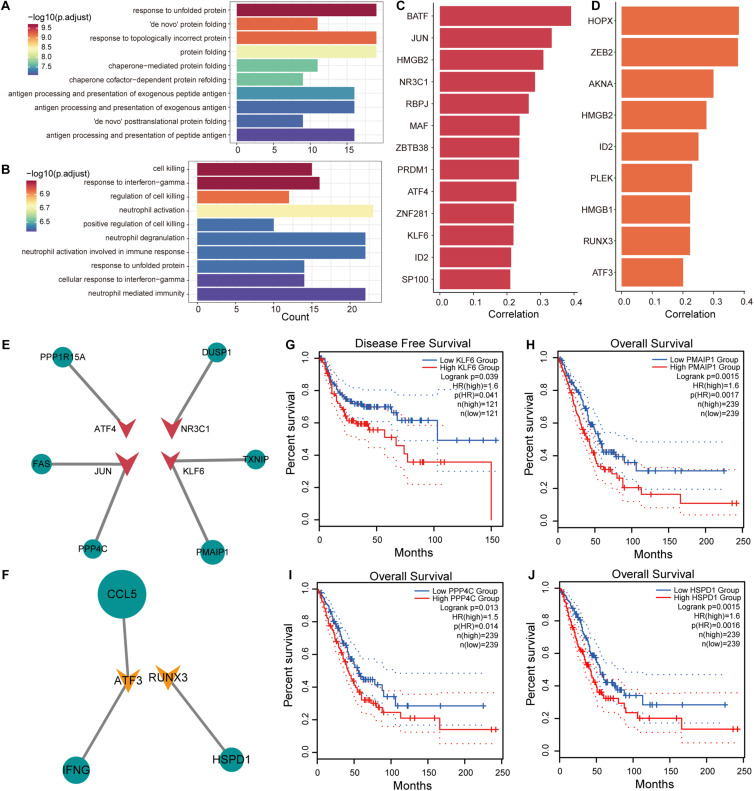
FIGURE 4.
Transcriptional regulation of genes associated with T-cell differentiation. (A) Enrichment results of upregulated genes associated with T/CD4+ differentiation in the gene ontology (GO) term. (B) Same as in (A) but for genes associated with T/CD8+ differentiation. (C) Transcription factor (TF) lists selected from genes positively associated with T/CD4+ differentiation and their Pearson correlation coefficients with pseudo-time. (D) Same as in (C) but for TF lists selected from genes associated with T/CD8+ differentiation. (E) The transcriptional regulatory network of TFs and target genes in genes related to T/CD4+ differentiation. The size of the nodes in the network represents the correlation coefficient, the circle represents the target gene, and the triangle represents the TF. (F) Same as in (E) but for genes related to T/CD8+ differentiation. (G) Survival curves comparing disease-free survival (DFS) of patients with high and low KLF6 gene expression. (H–J) Survival curves comparing overall survival (OS) of patients with high and low PMAIP1, PPP4C, and HSPD1 gene expression.

