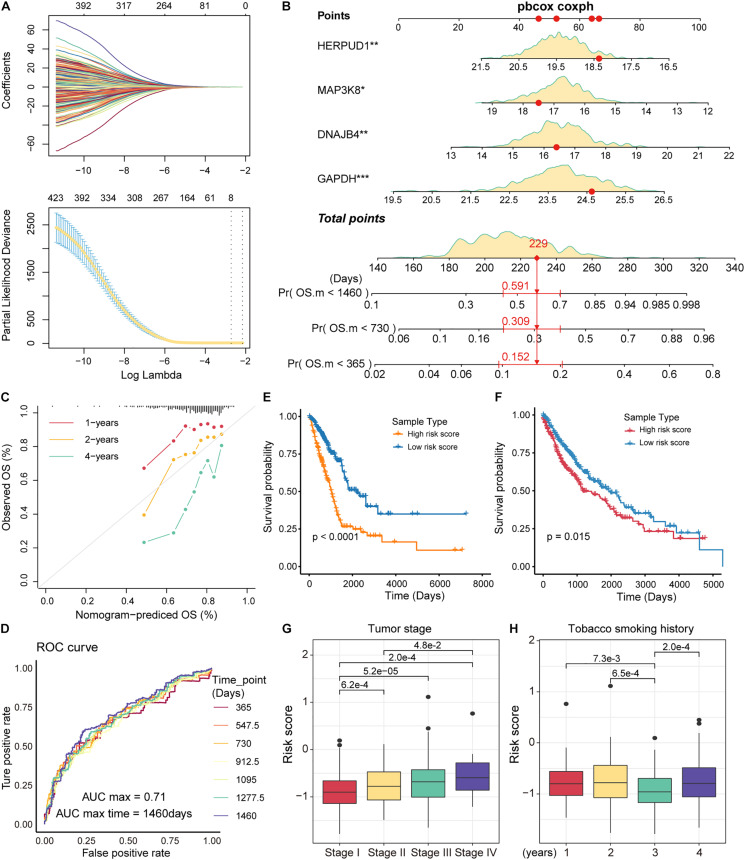
FIGURE 5.
Identification of prognostic markers in non-small cell lung cancer (NSCLC). (A) The curves reflect the relationship between the regression coefficient and λ value. The features were selected by the lasso regression model. (B) Nomogram for survival risk prediction of 1, 2, and 4 years. The model contains four feature genes (prognostic markers). (C) Calibration curve of the nomogram. (D) Receiver operating characteristic (ROC) plots of the outcomes predicted by the risk regression model for seven time points. The different colored curves represent specific time points. (E) Kaplan-Meier (KM) curves for the survival time (days) of lung adenocarcinoma (LUAD) samples in high- and low-risk categories. The log-rank test was used to calculate statistical significance. (F) Same as in (E) but for the survival of lung squamous cell carcinoma (LUSC) samples. (G) Box plots of risk scores for different tumor stage samples. The rank-sum test was used to statistically measure differences between groups. (H) Same as in (G) but for samples with different smoking histories.

