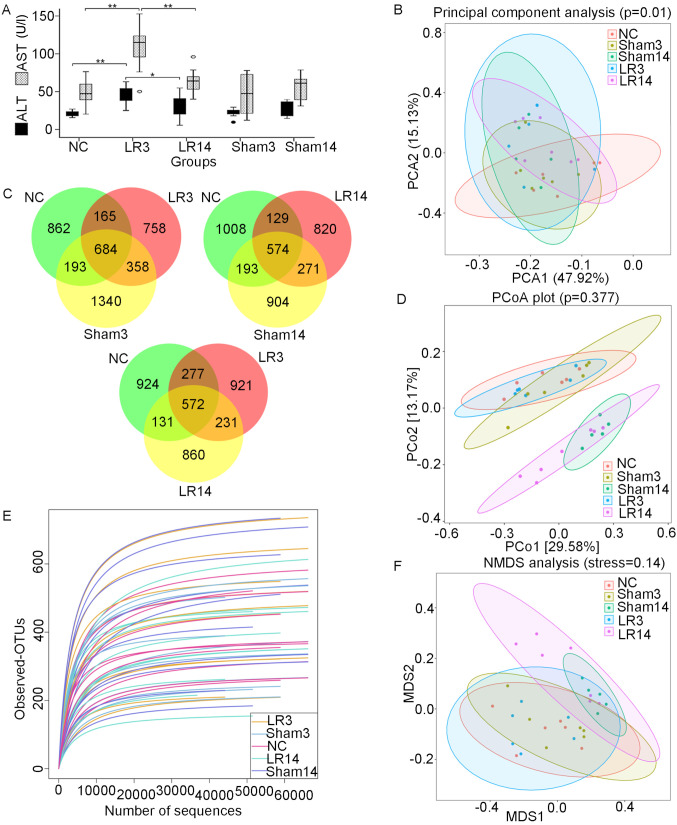
Figure 1.
Changes in liver function and gut microbiota following 50% partial hepatectomy. (A) Liver ALT and AST levels. Values are expressed as the median (interquartile range) (n=10 per group). *P<0.05, **P<0.01 according to ANOVA with LSD post-hoc test. (B) PCA of the bacterial community of the small intestinal contents of the mice. (C) Three-part Venn diagrams display the OTUs shared among the groups. The numbers in the diagrams represent the numbers of unique OTUs in each group or shared between groups as their areas intersect. (D) Unweighted UniFrac distance-based PCoA plots. (E) Rarefaction curves. (F) Unweighted UniFrac distance-based NMDS. Groups: NC, normal control; LR3, 3 days post-liver resection; LR14, 14 days post-liver resection; Sham3, 3 days post-sham operation; Sham14, 14 days post-sham operation; OTU, operational taxonomic unit; PCA, principal component analysis; PCoA, principal coordinate analysis; NMDS, non-metric multidimensional scaling; ALT, alanine aminotransferase; AST, aspartate aminotransferase.

