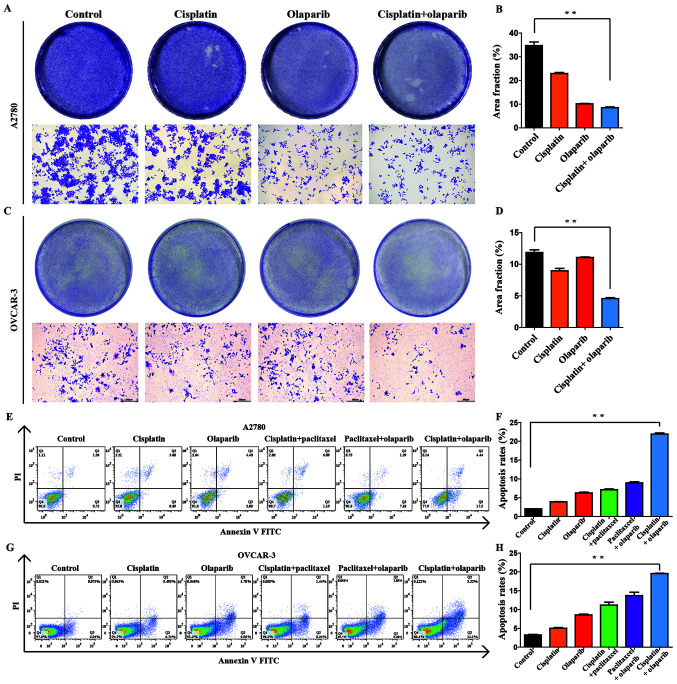
Figure 4.
Effect of low-dose treatments on the proliferation of ovarian cancer cells. (A) Role of four groups in the proliferation of A2780 cells examined by a crystal violet assay. The 60-mm cell culture dishes were observed and imaged under a microscope (magnification, x100). (B) Rate of stained cells was determined using ImageJ software. Data are presented as the mean ± SEM (n=3). (C) Role of four groups in the proliferation of OVCAR-3 cells examined by a crystal violet assay. (D) Rate of stained cells was determined using ImageJ software. Data are presented as the mean ± SEM (n=3). (E) Role of six groups in the apoptosis of A2780 cells assessed by flow cytometry. (F) Rate of apoptosis was determined using FlowJo 7.6.1 software. (G) Role of six groups in the apoptosis of OVCAR-3 cells assessed by flow cytometry. (H) Rate of apoptosis was determined using FlowJo 7.6.1 software. **P<0.01.

