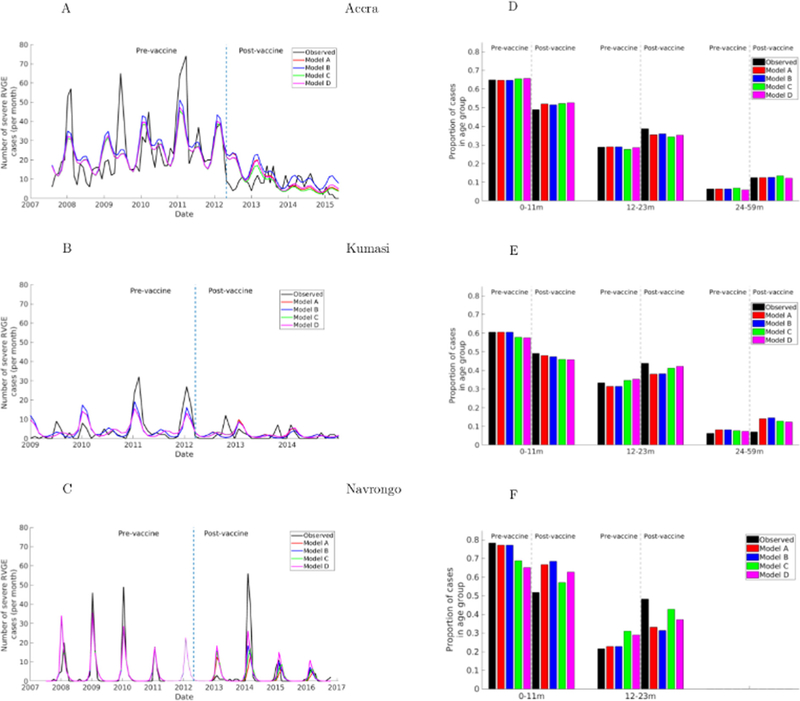
Fig. 3. Fit of models to the observed data.
(Left) Model-predicted and observed monthly incidence of severe RVGE cases among children during both pre- and post-vaccine periods. The vertical line indicates the date of vaccine introduction (April 2012). (Right) Model-predicted and observed proportion of severe RVGE in each age group before and after vaccine introduction. The grey dashed lines separate the pre- and post-vaccination distribution for each age group. The light line region of C indicates model predictions for Navrongo for the period with missing data.

