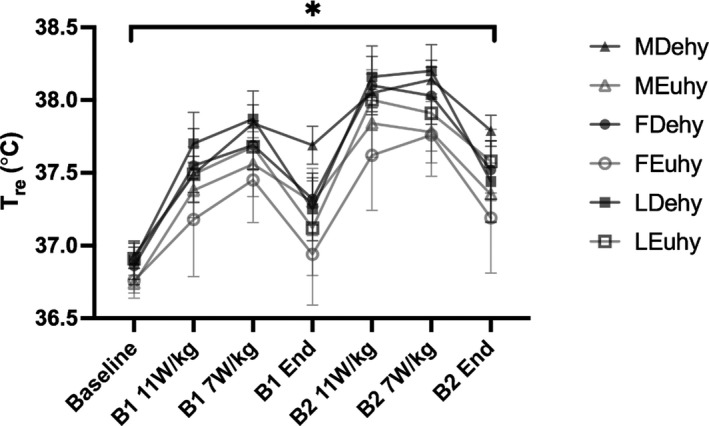
FIGURE 2.

Absolute T re measures collected at the end of each exercise intensity within each block analyzed via three‐way analysis of variance, n = 12 men, n = 7 women. B1 = block 1, B2 = block 2. 11 and 7 W/kg are representative of prescribed heat production intensities. *denotes the significant main effect of time and hydration status across groups (p < 0.001 for both variables). Data are presented as mean ± SE
