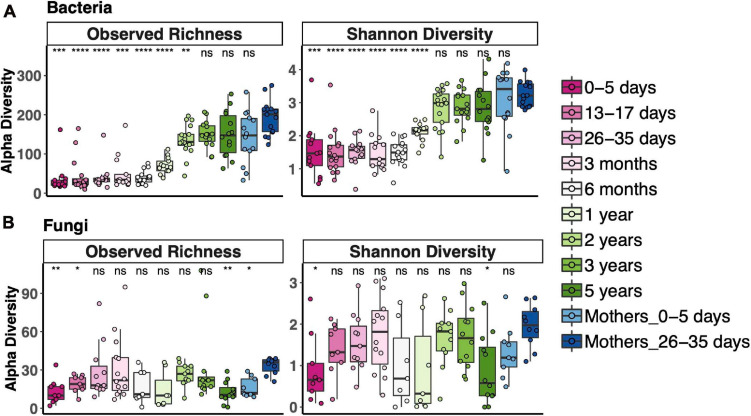
FIGURE 1.
Alpha diversity across the age spectrum for bacterial fecal communities (A) and fungal fecal communities (B). Coding indicates values significantly different from those of adult communities (Mothers of 26–35-day-old newborns): ****p < 0.0001, ***p < 0.001, **p < 0.01, *p < 0.05; Wilcoxon rank-sum test adjusted using the Bonferroni correction. Boxplots indicate medians with first and third quartiles (25–75%). Whiskers extend no farther than 1.5*IQR from the hinge.

