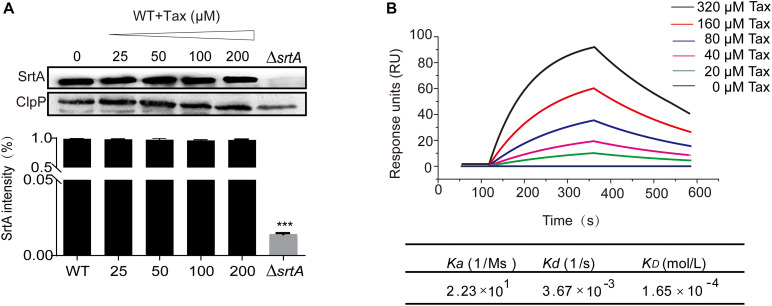
FIGURE 4.
Expression of SrtA in the presence of Tax and the interaction of different concentrations of Tax with SrtA. (A) Western blot analysis of SrtA protein from S. aureus treated with various concentrations of Tax and grayscale analysis of SrtA protein bands. (B) LSPR analysis verified the binding affinity of Tax with SrtA. Error bars represent means ± SD of three replicates. ***P < 0.001 calculated with a two-tailed Student’s t-test.

