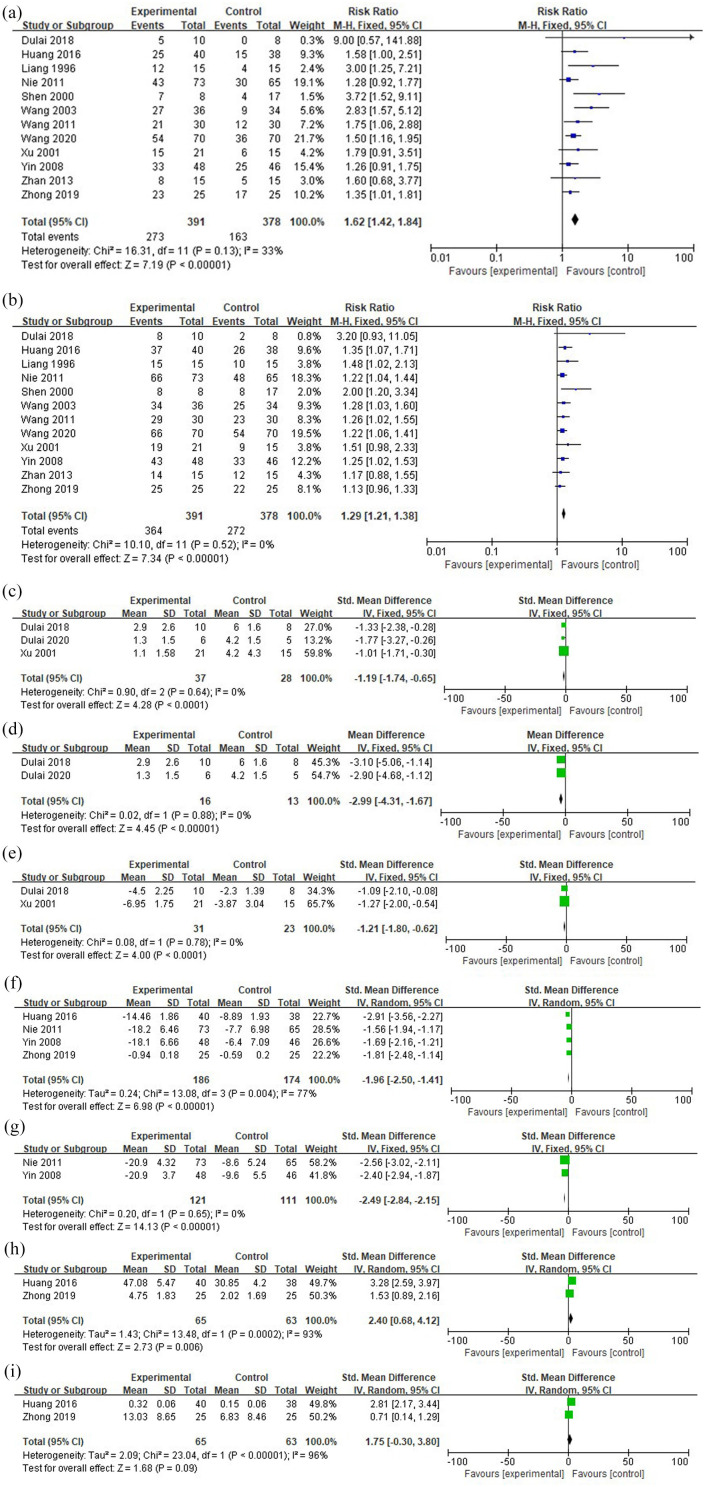
Figure 2.
Forest plots. (a) Clinical remission. (b) Clinical response. (c) Disease activity scores. (d) Partial Mayo scores. (e) Changes in disease activity scores. (f) Changes in serum TNF-α level. (g) Changes in serum IL-6 level. (h) Changes in serum IL-10 level. (i) Changes in serum superoxide dismutase level.
CI, confidence interval; IV, inverse variance; M-H, Mantel-Haenszel; Std., standardized.

