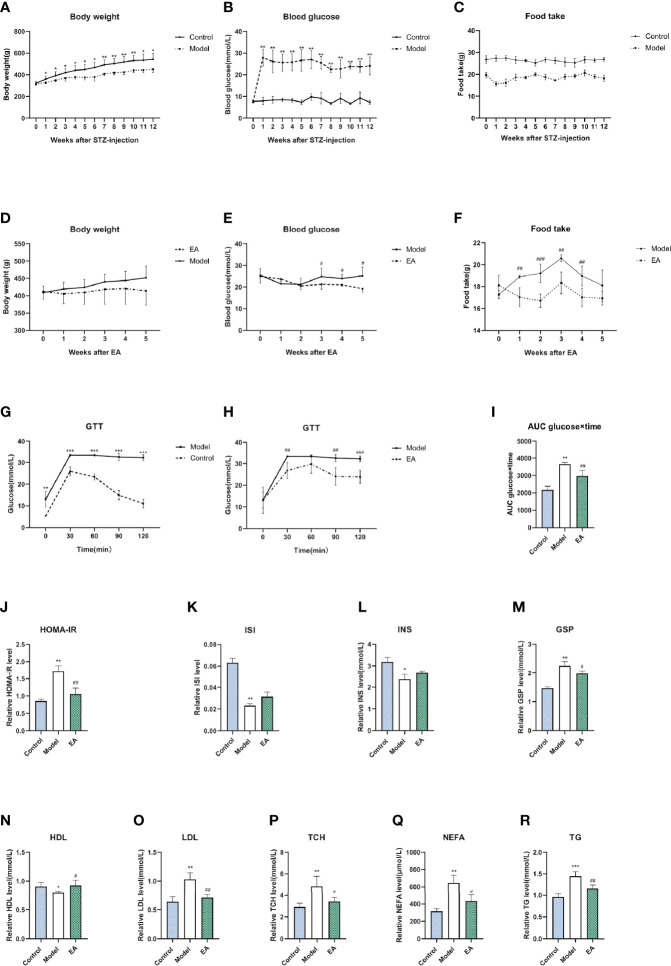
Figure 1.
Metabolism index of HFD-STZ rats in different groups. Levels of body weight (A), blood glucose (B), food intake (C), and glucose tolerance test (GTT) (G) in the control group and model group over 12 weeks (n = 6, *p < 0.05, **p < 0.01, ***p < 0.001). The significance was not marked in the figure since the food was not the same. Compared to the model group, EA treatment decreased body weight (D), blood glucose (E), food intake (F), as well as hyperglycemia in GTT (H) and related AUC levels (I) significantly (n = 6, #P < 0.05, ##P < 0.01, ###P < 0.001). Levels of homeostasis model assessment for insulin resistance (J), insulin sensitivity index level (K), fasting insulin level (L), glycosylated serum protein level (M), high density lipoprotein level (N), low density lipoprotein level (O), total cholesterol level (P), non-esterified fatty acid (Q), and triglycerides level (R) in serum of rats after saline, HFD-STZ-induced, and EA treatment (n = 4, *p < 0.05, **p < 0.01, ***p < 0.001, #p < 0.05, ##p < 0.01).

