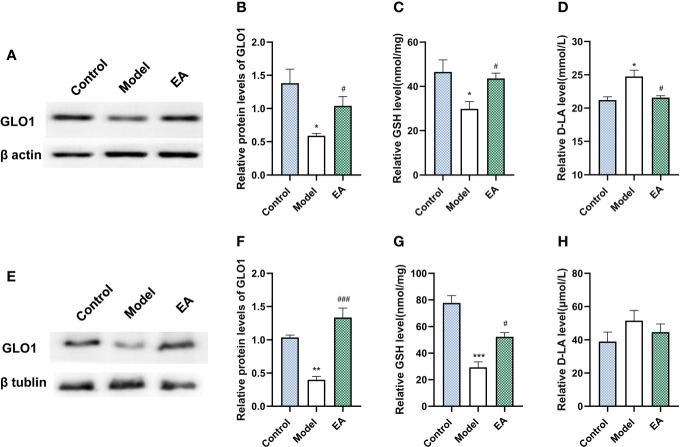
Figure 6.
Effect of EA on the expression of GLO1, GSH, and D-lactate in footpad skin and sciatic nerve. (A) Representative Western blot analysis of GLO1 staining and (B) relative protein levels in footpad skin (n=3, *p < 0.05, #p < 0.05). (C) Representative ELISA analysis of GSH and (D) D-lactate in footpad skin (n=4, *p < 0.05, #p < 0.05). (E) Representative Western blot analysis of GLO1 staining and (F) relative protein levels in sciatic nerve (n=3, **p < 0.01, ###p < 0.001). (G) Representative ELISA analysis of GSH and (H) D-lactate in sciatic nerve (n=4, ***p < 0.001, #p < 0.05).

