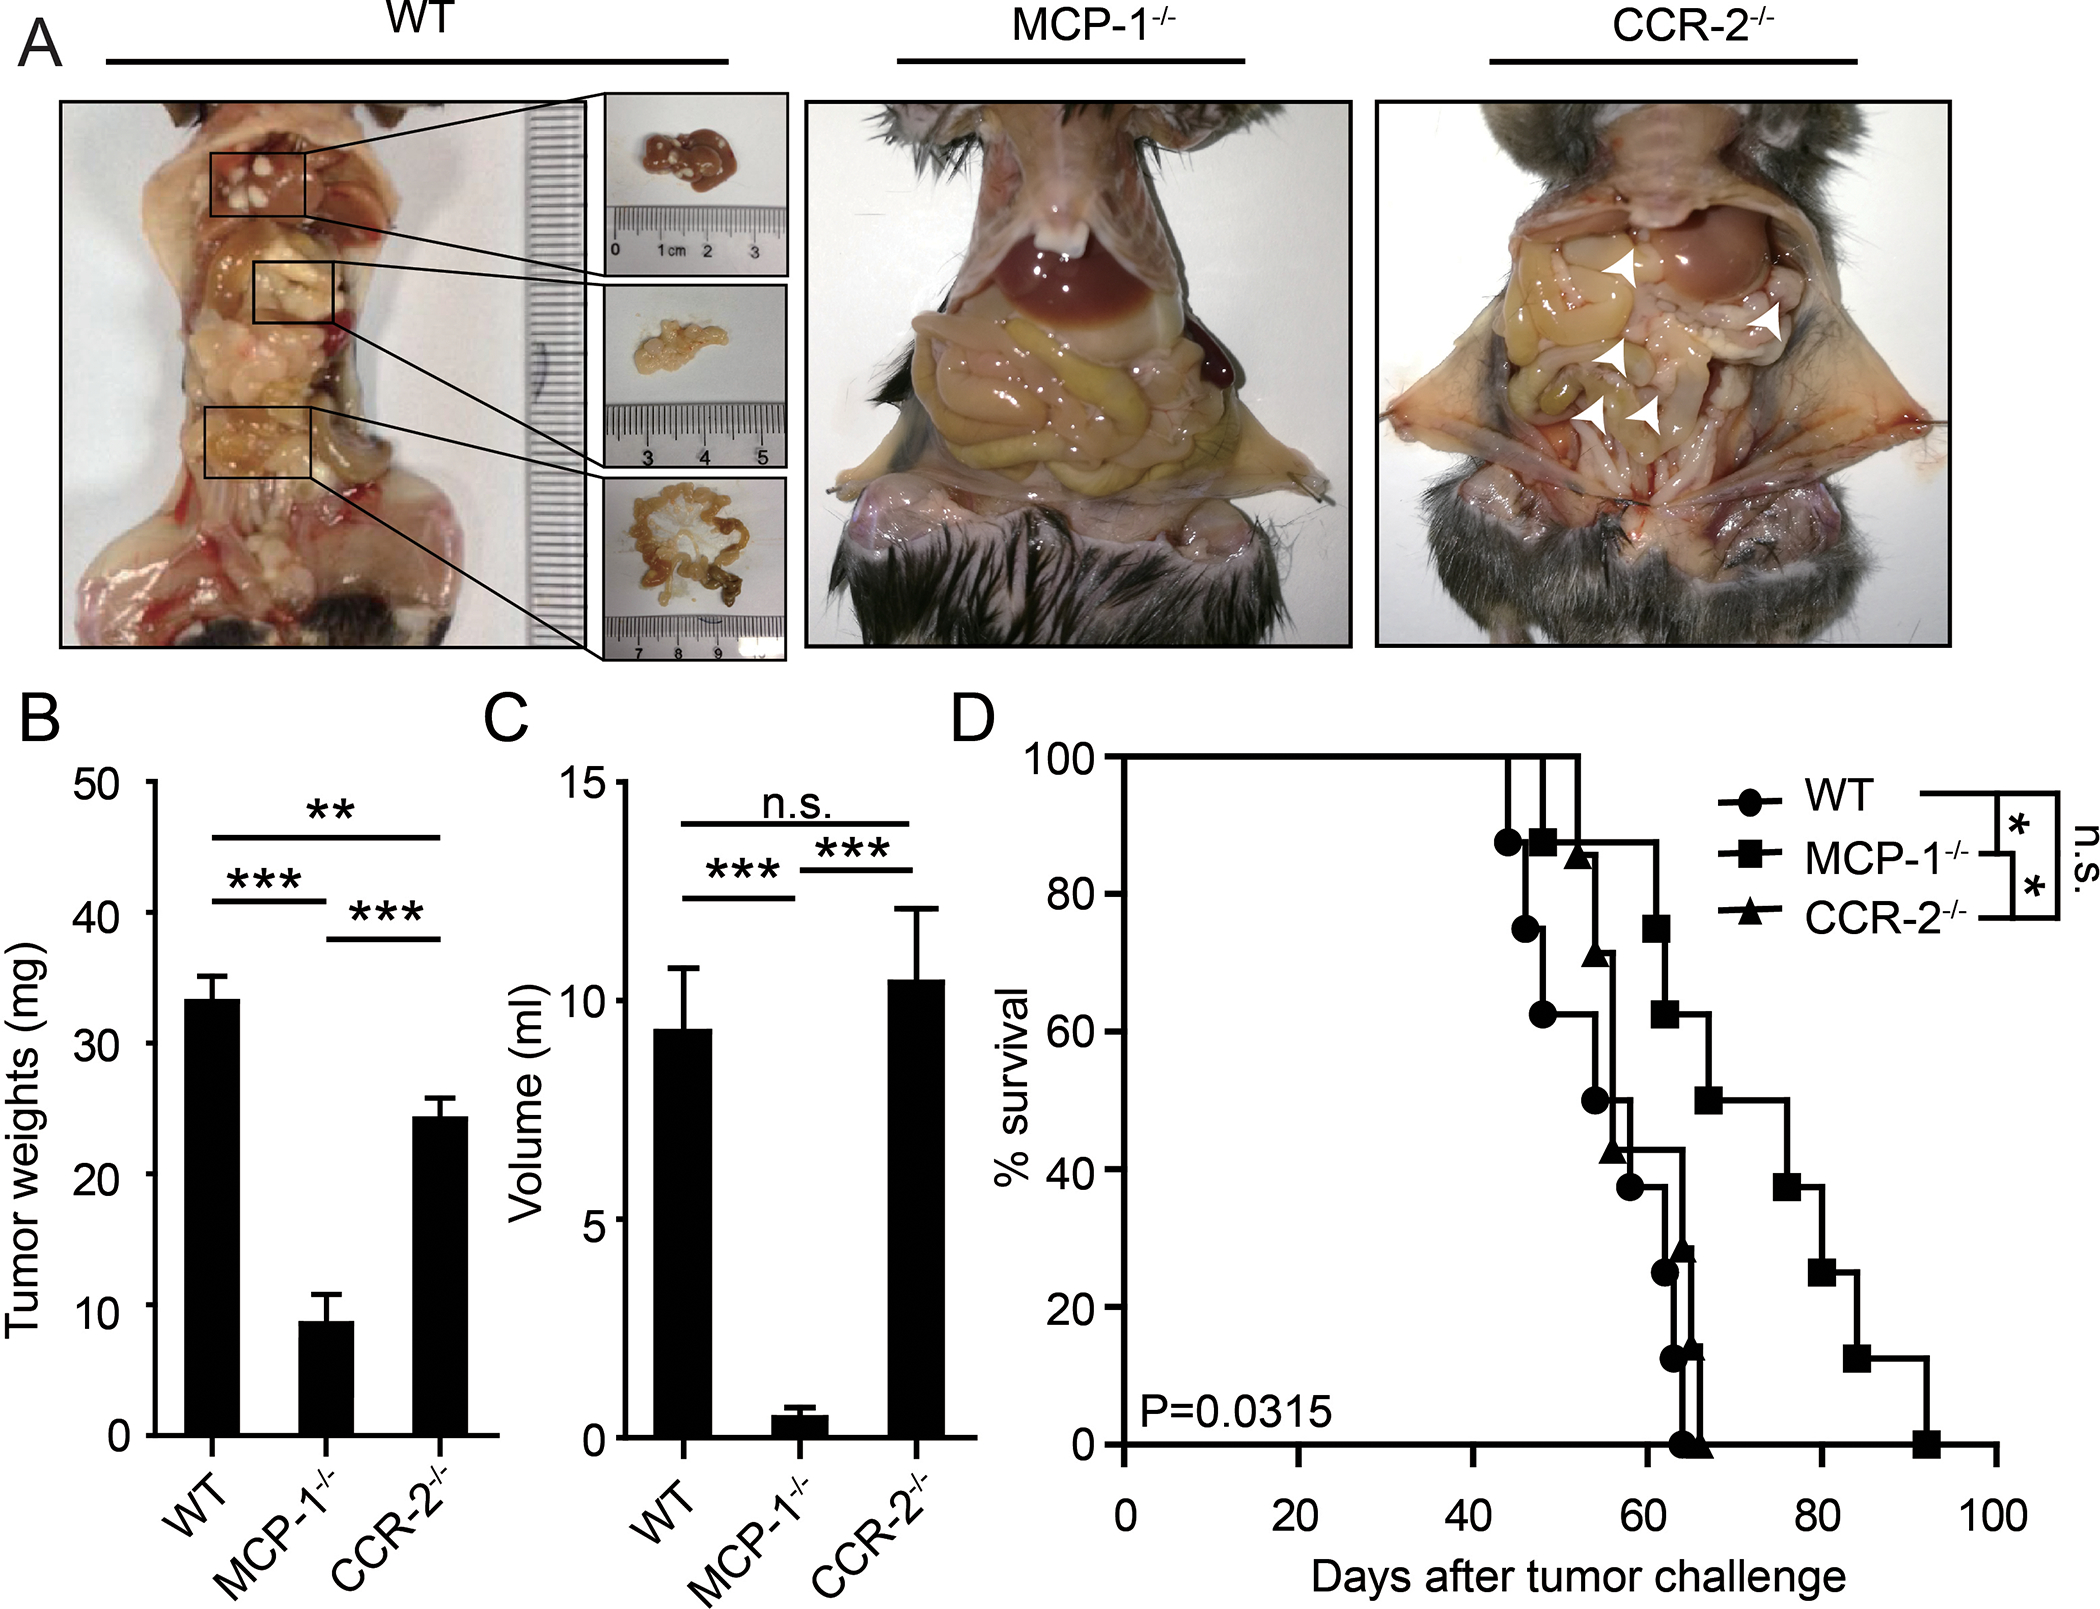
Figure 3. CCR-2 in ovarian cancer cells, but not in microenvironment cells, interact with the of MCP-1 and then promote tumor growth and metastasis.

(A) Gross anatomy of tumor burdens in WT, MCP-1−/−, and CCR-2−/− mice. The liver, omentus, and mesentery metastases in WT mice were enlarged. The white arrows indicated micrometastases in CCR-2−/− mice. (B) Bar graph of tumor weights. (C) Bar graph of the ascites volumes in WT, MCP-1−/−, and CCR-2−/− mice. Date are presented as the mean ± SEM, Student’s t test. ***p< 0.001. n.s. no siginificancy. (D) The K-M survival curves of the overall survival of WT, MCP-1−/−, and CCR-2−/− mice. The statistical significance (P value) was test by log-rank test.
