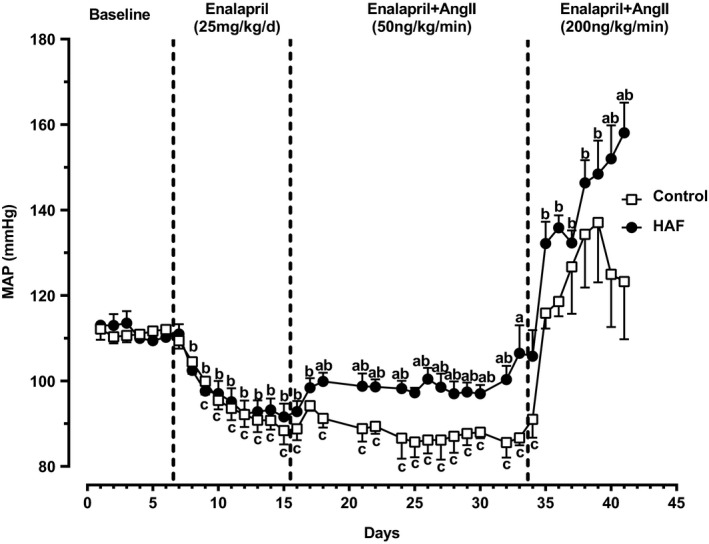
FIGURE 2.

Baseline mean arterial pressure (MAP), depressor response to enalapril, and pressor response to Ang II (50 ng/kg/min or 200 ng/kg/min) in male control (n = 3) and HAF offspring (n = 5). MAP was measured by radiotelemetry. Statistical analyses were done by repeated measures ANOVA. Data are shown as standard error of the mean. a p < 0.05, MAP in male HAF offspring compared with control offspring; b p < 0.05, HAF offspring compared to baseline; c p < 0.05, control offspring compared to baseline
