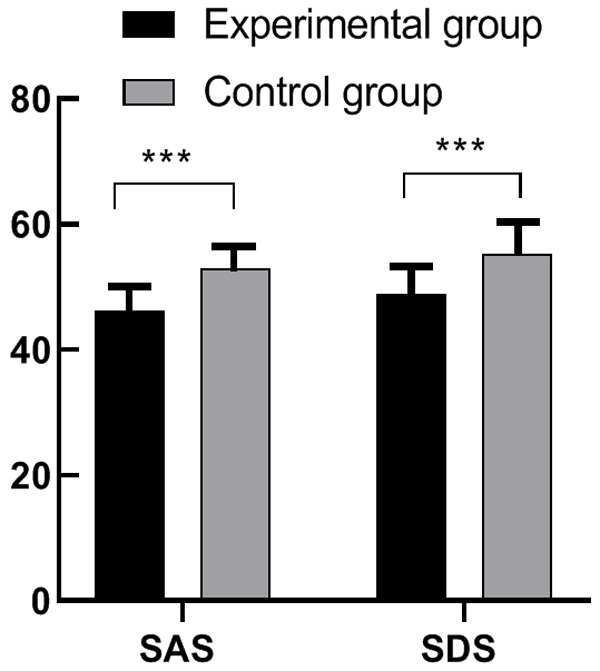
Figure 2.

Comparison of SAS, SDS anxiety and depression scale scores between the two groups. Notes: The abscissa indicates the SAS, SDS anxiety and depression scores in the experimental group and the control group from left to right, and the ordinate indicates the scores. Comparison of SAS scores between the experimental group [(46.22±4.02) points] and the control group [(53.10±5.20) points] (t = 6.62, ***P < 0.001). Comparison of SAS scores between the experimental group [(48.89±4.48) points] and the control group [(55.27±5.61) points] (t = 5.62, ***P < 0.001).
