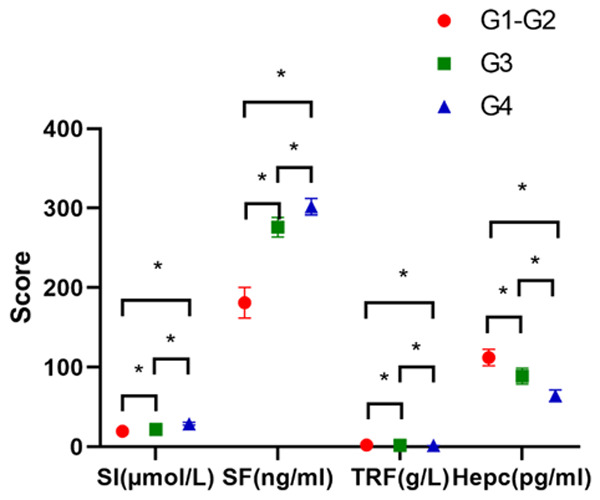
Figure 2.

Comparison of the hepcidin and iron levels in the patients with different inflammatory activity. The SI and SF levels in the severe group (G4) were significantly higher than they were in the moderate group (G3), and the SI and SF levels in the G3 group were significantly higher than they were in the mild group (G1-G2) (P<0.05). The TRF and Hepc levels in the G4 group were significantly lower than they were in the G3 group, and the TRF and Hepc levels in the G3 group were significantly lower than they were in the G1-G2 group (P<0.05). * indicates a significant difference between groups of the same indicator, P<0.05.
