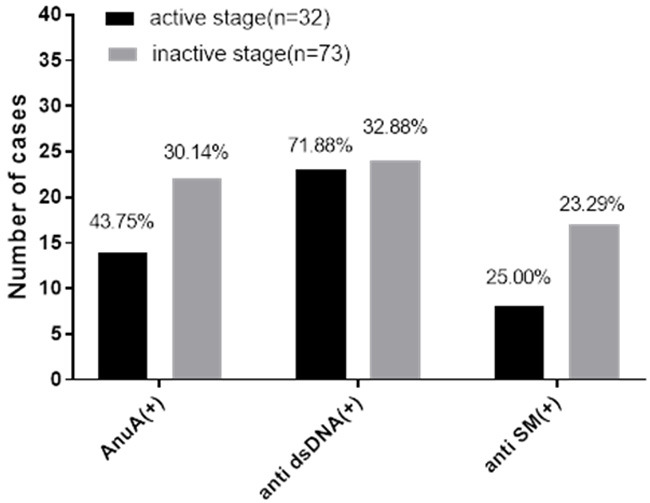
Figure 1.

Analysis of the serum AnuA, anti-dsDNA and anti-SM in the active and inactive patients in the SE group. Note: The abscissa indicates AnuA (+), anti-sDNA (+), anti-SM (+), while the ordinate indicates the number of cases. It can be seen from Figure that the positive rates of AnuA, anti-dsDNA, and anti-SM in the active stage were all higher than they were in the inactive stage. The positive rates of the anti-dsDNA were compared among the groups, with significant differences (χ2=13.6845, P < 0.05), and the positive rates of AnuA and anti-SM were compared among the groups, with no significant differences (χ2=1.8299, 0.0360, all P > 0.05).
