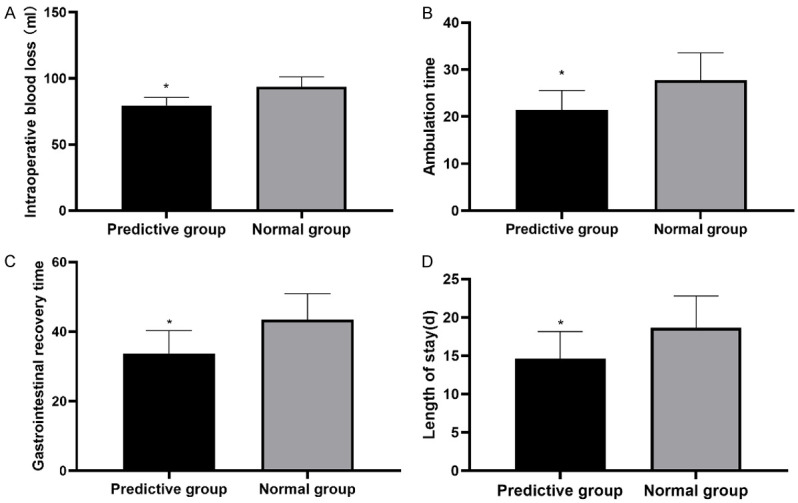
Figure 1.

The operative indications of the two groups of patients. A. Intraoperative blood loss: the intraoperative blood loss in the PG was less than it was in the NG (P < 0.05); B. The getting out of bed times: the getting out of bed times in the PG were shorter than they were in the NG (P < 0.05); C. Gastrointestinal tract recovery times: the gastrointestinal tract recovery times of the patients in the PG were shorter than they were in the NG (P < 0.05); D. Lengths of stay: the durations of the hospital stay of the patients in the PG were shorter than they were in the NG (P < 0.05). Note: *means compared with the NG, P < 0.05.
