Figure 5.

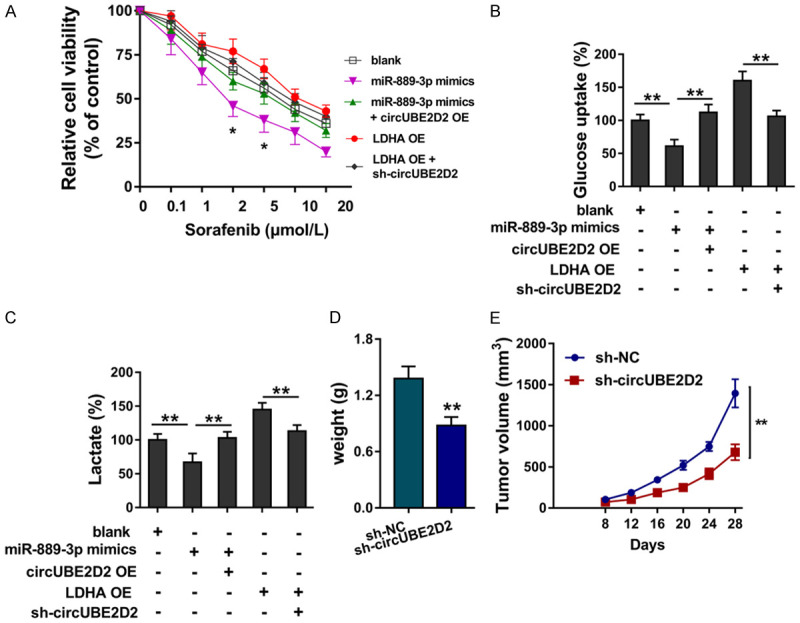
circUBE2D2/miR-889-3p/LDHA axis regulates the HCC sorafenib resistance and glycolysis. (A) Sorafenib sensitivity assay was performed using HCC cells (HepG2). HepG2 cells were transfected with miR-889-3p mimics and/or circUBE2D2 overexpression (circUBE2D2 OE), LDHA overexpression (LDHA OE) and/or circUBE2D2 knockdown (sh-circUBE2D2). (B) Glucose consumption was detected in HCC cells (HepG2) using glucose assay kit. (C) Lactate production was detected using lactate colorimetric assay kit. (A-C) Experiments were performed in triplicate and were repeated three times. (D) Tumor weight and (E) volume were detected using in vivo mice xenograft assay (10 mice). **P<0.01 vs. control. *P<0.05 vs. control.
