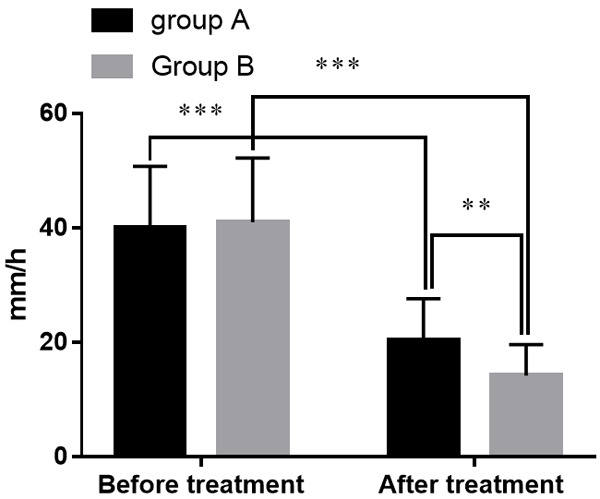
Figure 1.

Comparison of ESR levels in groups A and B. Note: The X-axis indicates before and after treatment, and the Y-axis indicates the level of ESR (mm/h). The ESR levels of patients in group A before treatment were (40.02±10.75) mm/h while (20.3±7.3) mm/h after treatment. The ESR levels of patients in group B before treatment were (40.95±11.26) mm/h while (14.2±5.4) mm/h after treatment. **means that a significant difference with P<0.01 and ***means that a significant difference with P<0.001.
