
Figure 5.
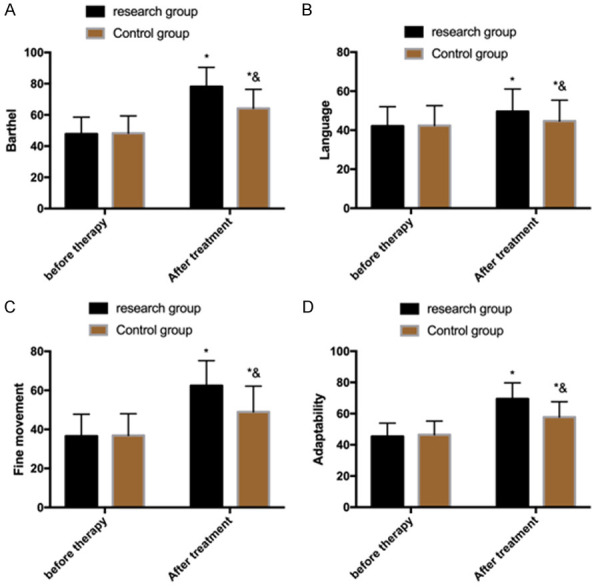
Comparison of scores of MBI and GDS. A. MBI scores in the two groups. B. Language scores of children in the two groups. C. Scores of fine motion skills of children in the two groups. D. Adaptability score of children in the two groups. Note: *P<0.05 vs. before treatment, &P<0.05 vs. research group. MBI: modified Barthel index; GDS: Gesell’s Developmental Schedule.