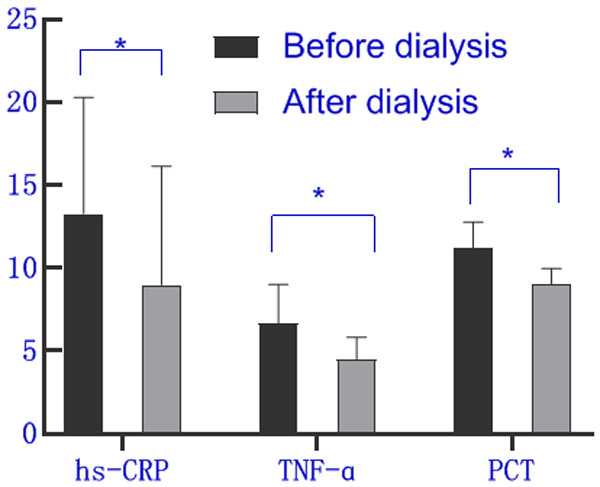
Figure 2.

Comparison of the expression levels of hs CRP, TNF-α and PCT before and after dialysis. Note: The abscissa represents hs-CRP, TNF-α, PCT from left to right, and the ordinate represents the expression level of hs-CRP (mg/L), TNF-α (ng/mL), and PCT (ng/mL). Comparison of expression levels of hs-CRP (mg/L) before and after dialysis [(13.28±7.00) mg/L vs (8.99±7.15) mg/L] was statistically significant (t=3.03, *P=0.003); Comparison of expression levels of TNF-α (ng/mL) before and after dialysis [(6.67±2.34) ng/mL vs (4.49±1.33) ng/mL] was statistically significant (t=5.73, *P < 0.05); Comparison of expression levels of PCT (ng/mL) before and after dialysis [(11.22±1.57) ng/mL vs (9.00±0.97) ng/mL] was statistically significant (t=8.51, *P < 0.05).
