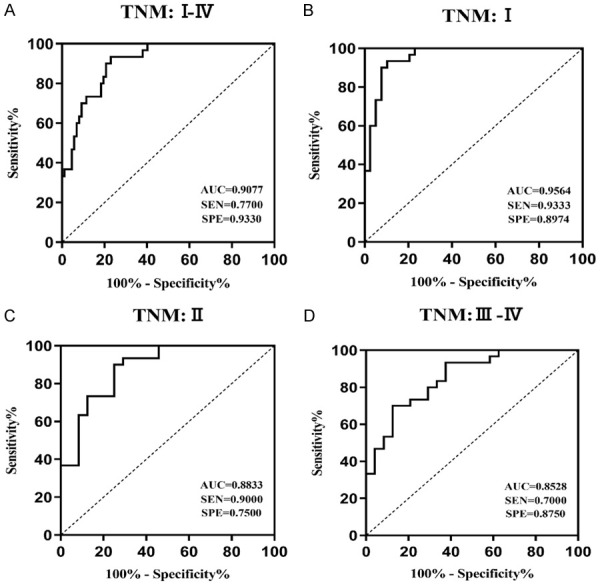
Figure 4.

ROC curve analysis of exo_circ_0006602 expression level in the TNM subgroup. (A) 87 HCC cases stage I-IV; the AUC value was 0.9077. (B) in cases of TNM stage I, the AUC value was 0.9564. (C) in cases of TNM stage II, the cut-off value was 0.8833; and (D) in cases of TNM stage III-IV, the AUC value was 8528.
