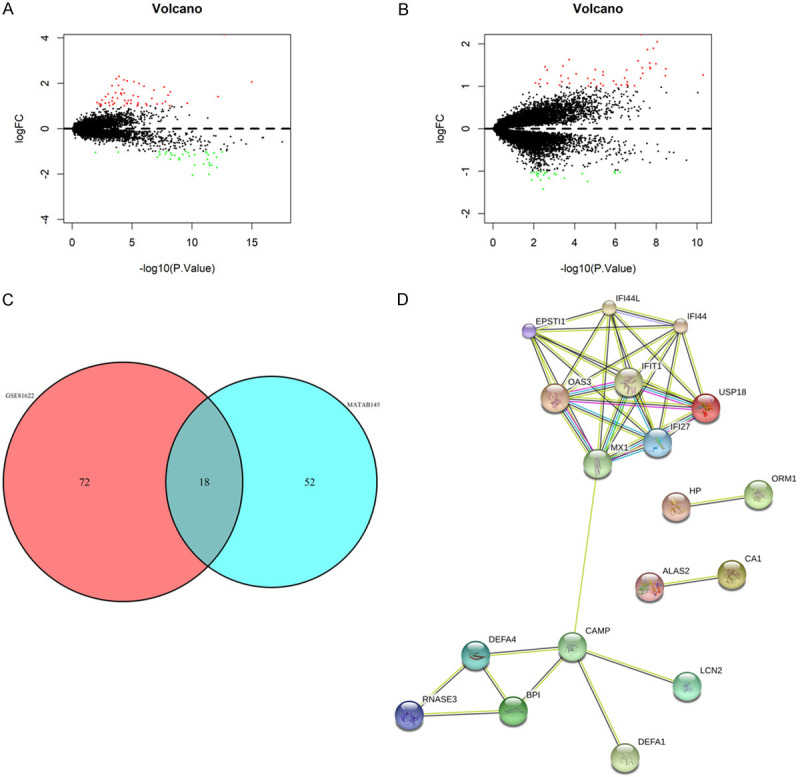
Figure 1.

A. The volcano figure of GSE81622. The horizontal axis is -log10 (P value), and the vertical axis is log2 (FC). Each point represents a gene. Ninety genes with significantly differentially expressed genes were screened out, and 56 up-regulated genes and 34 down-regulated genes were identified (|logFC| > 1, P < 0.05). B. The volcano figure of MTAB145. The horizontal axis is -log10 (P value), and the vertical axis is log2 (FC). Each point represents a gene. Screening 70 statistically significant differentially expressed genes yielded 48 up-regulated and 22 down-regulated genes (|logFC| > 1 and P < 0.05). C. Venn diagram of GSE81622 and MTAB145. It shows that the two chips share 18 genes. D. Gene protein-protein interaction networks for 18 differentially expressed genes. MX1 connected eight nodes.
