
Figure EV3. smFISH distributions are well fit by the probability density function for the two‐state promoter model (related to Fig 3).
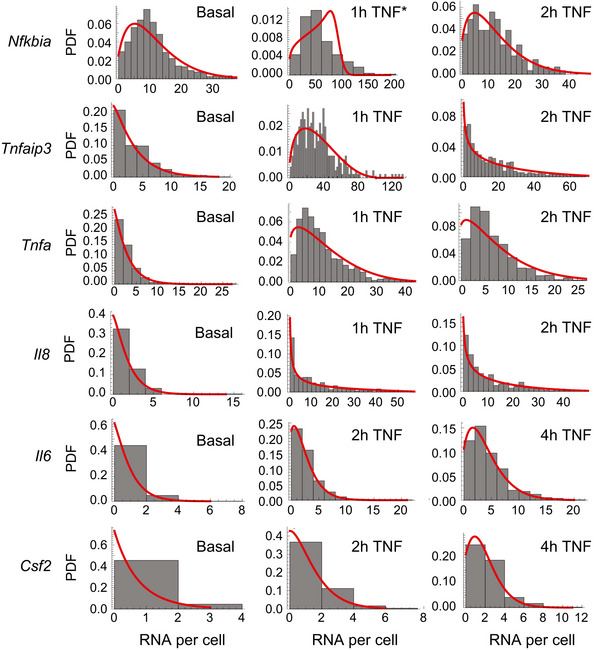
Histograms (gray) of mRNA distributions for the indicated genes measured by smFISH in the basal state and after 20 ng/ml TNF treatment for combined experimental datasets unless indicated. Red curves show the best fit of the theoretical probability density function solution for the random telegraph model obtained by maximum likelihood estimation. *Fit for Nfkbia 1‐h TNF distribution is for one replicate only (see Materials and Methods).