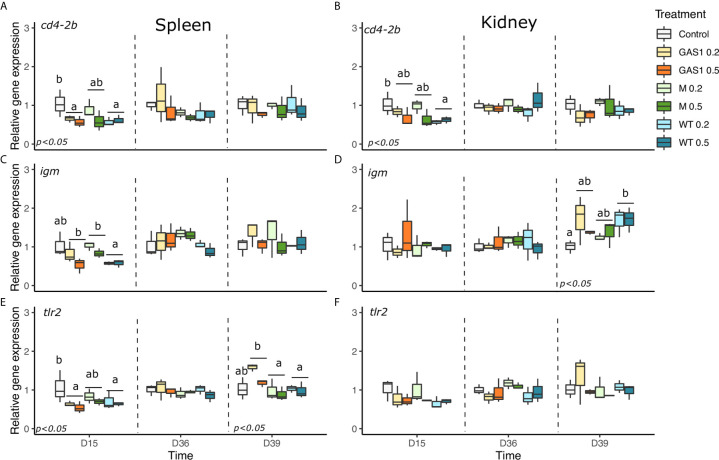
Figure 4.
Effects of dietary beta glucan on T-helper (cd4-2β), humoral (mIgM) and membrane protein (TLR2) genes expressions in the spleen and kidney of fish sampled during the nutrient test on D15 and D36, or 2 days after the bacterial challenge (D39). (A–F) are expression levels of cd4-2β, mIgM, TLR2 in spleen and kidney, respectively. Relative transcript (mRNA) levels were determined by real-time RT-PCR and normalized by the arithmetic mean of ef-1α expression. Values are expressed as mean ± SD of 3 pool samples per experimental condition (3 fish per pool sample). Statistical differences, highlighted by letters, are indicated for glucan concentrations in front of 0, 0.2, and 0.5% next to the corresponding plot, for glucan type by letter above the horizontal bar grouping the two doses of the same glucan, for glucan type × concentrations interactions above each box. P values are shown at the bottom of each graph at a given time point (D15, D36, or D39).

