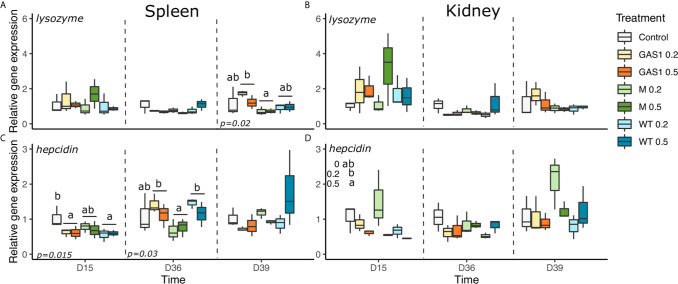
Figure 6.
Effects of dietary beta glucans on C-type lysozyme and Hepcidin genes expression in the spleen or kidney of fish sampled during the nutrient test on D15 and D36, or 2 days after the bacterial challenge (D39). (A) lysozyme gene expression in spleen. (B) lysozyme gene expression in kidney. (C) Hepcidin gene expression in spleen. (D) Hepcidin gene expression in kidney. Relative transcript (mRNA) levels were determined by real-time RT-PCR and normalized by the arithmetic mean of ef-1α gene expressions. Values are expressed as mean ± SD of three pool samples per experimental condition (3 fish per pool sample). Statistical differences, highlighted by letters, are indicated for glucan concentrations in front of 0%, 0.2%, and 0.5% next to the corresponding plot, for glucan type by letter above the horizontal bar grouping the two doses of the same glucan, for glucan type × concentrations interactions above each box. P values are shown at the bottom of each graph at a given time point (D15, D36, or D39).

