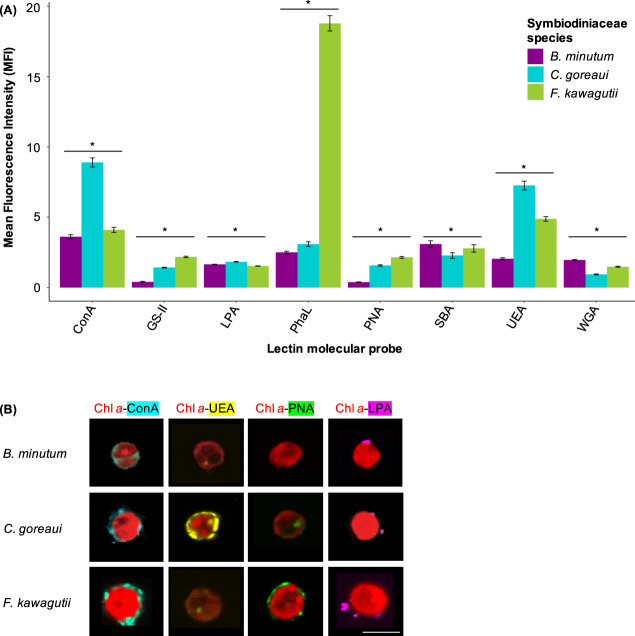
Fig. 3. Confocal microscopy of B. minutum (purple), C. goreaui (blue) and F. kawagutii (green) cell surfaces.
A Mean fluorescence intensity (MFI ± SEM) of lectin conjugate binding to the cell surface of a Symbiodiniaceae species. ConA = concanavalin A, GS-II = lectin from Griffonia simplicifolia, LPA = lectin from Limulus polyphemus (horseshoe crab), PhaL = lectin from Phaseolus vulgaris, PNA = lectin from Arachis hypogaea (peanut), SBA = lectin from Glycine max (soybean), UEA = lectin from Ulex europaeus, WGA = wheat germ agglutinin. Stars indicate statistically supported differences. B Representative cells of B. minutum, C. goreaui and F. kawagutii labelled with the lectin probes ConA (concavalin A specific for D-mannose and D-glucose; light blue), UEA (lectin from Ulex europaeus specific for α-L-fucose; yellow), PNA (lectin from Arachis hypogaea specific for lactose and D-galactose; green) and LPA (lectin from Limulus polyphemus specific for N-acetylneuraminic acid and glucuronic acid; magenta) and imaged using confocal microscopy. Scale = 10 μm.

