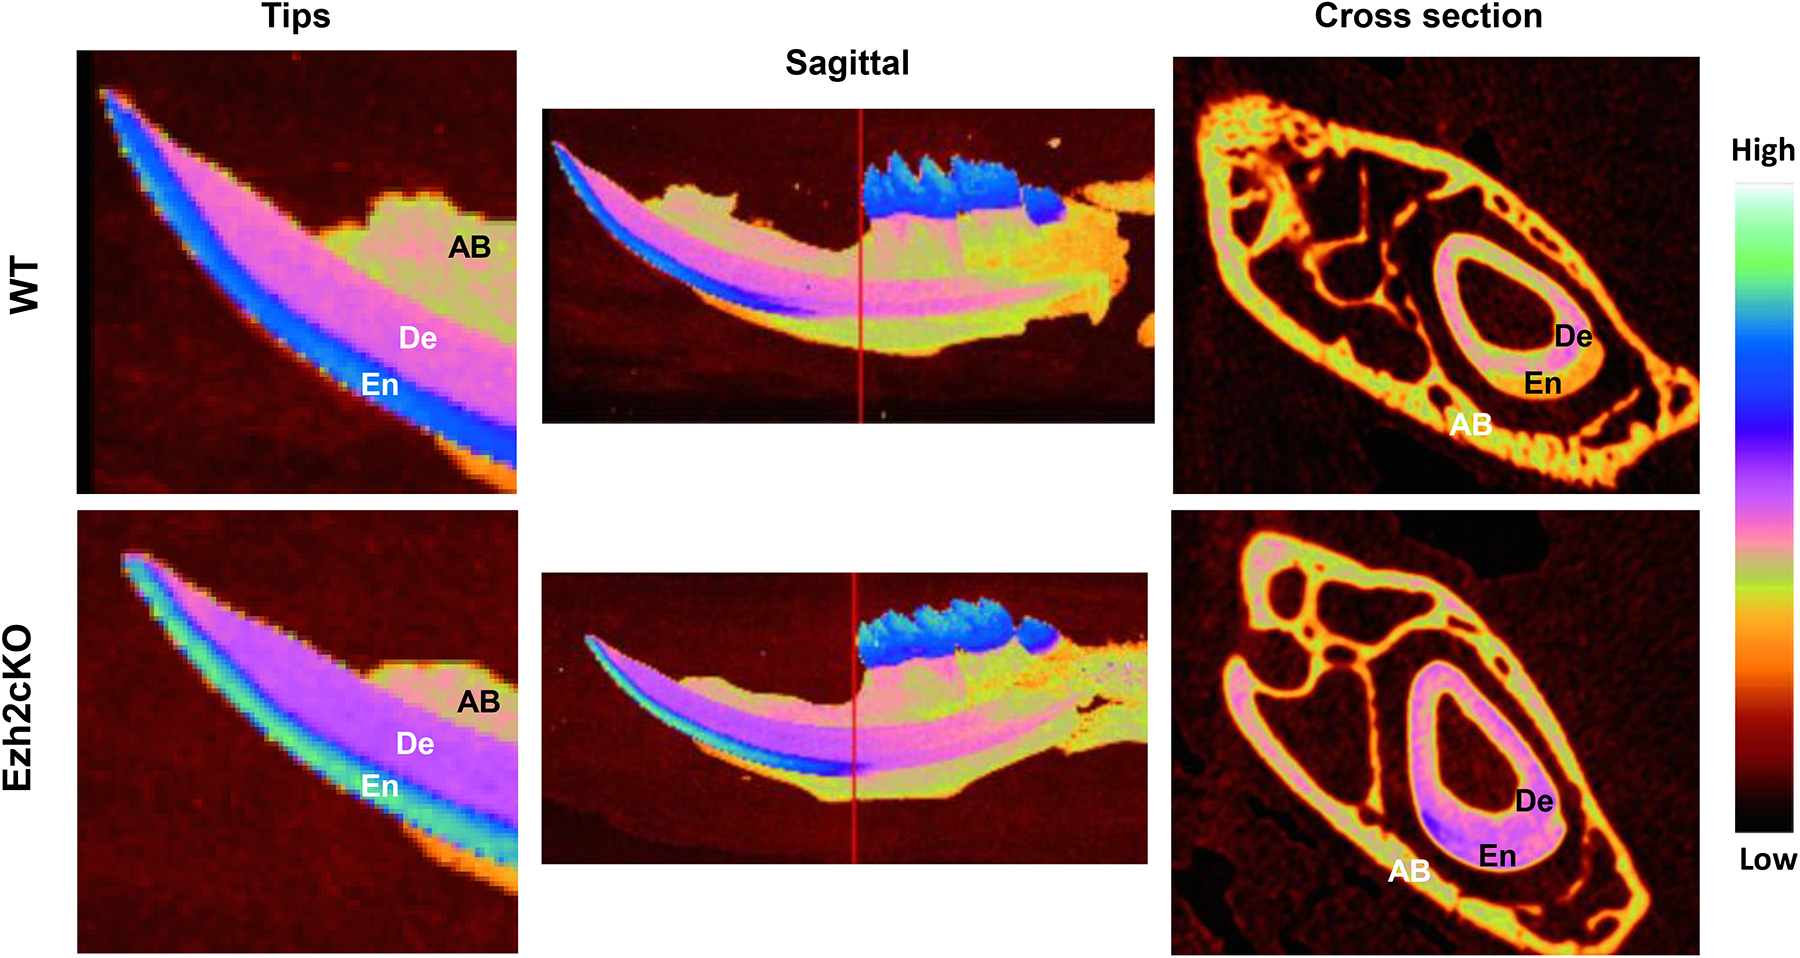
Fig. 1.

Typical microCT images of mandibles from the wild type (WT)(top) and conditional Ezh2 knockout (Ezh2cKO)(bottom) mice. Tip region (left), sagittal (middle) and cross section (right) images for those mice are shown. The mineral densities are displayed in pseudo-color, represented in the color bar at the far right. The red lines in sagittal images indicate the cross-section position. En, De, and AB indicate enamel, dentin, and alveolar bone, respectively.
