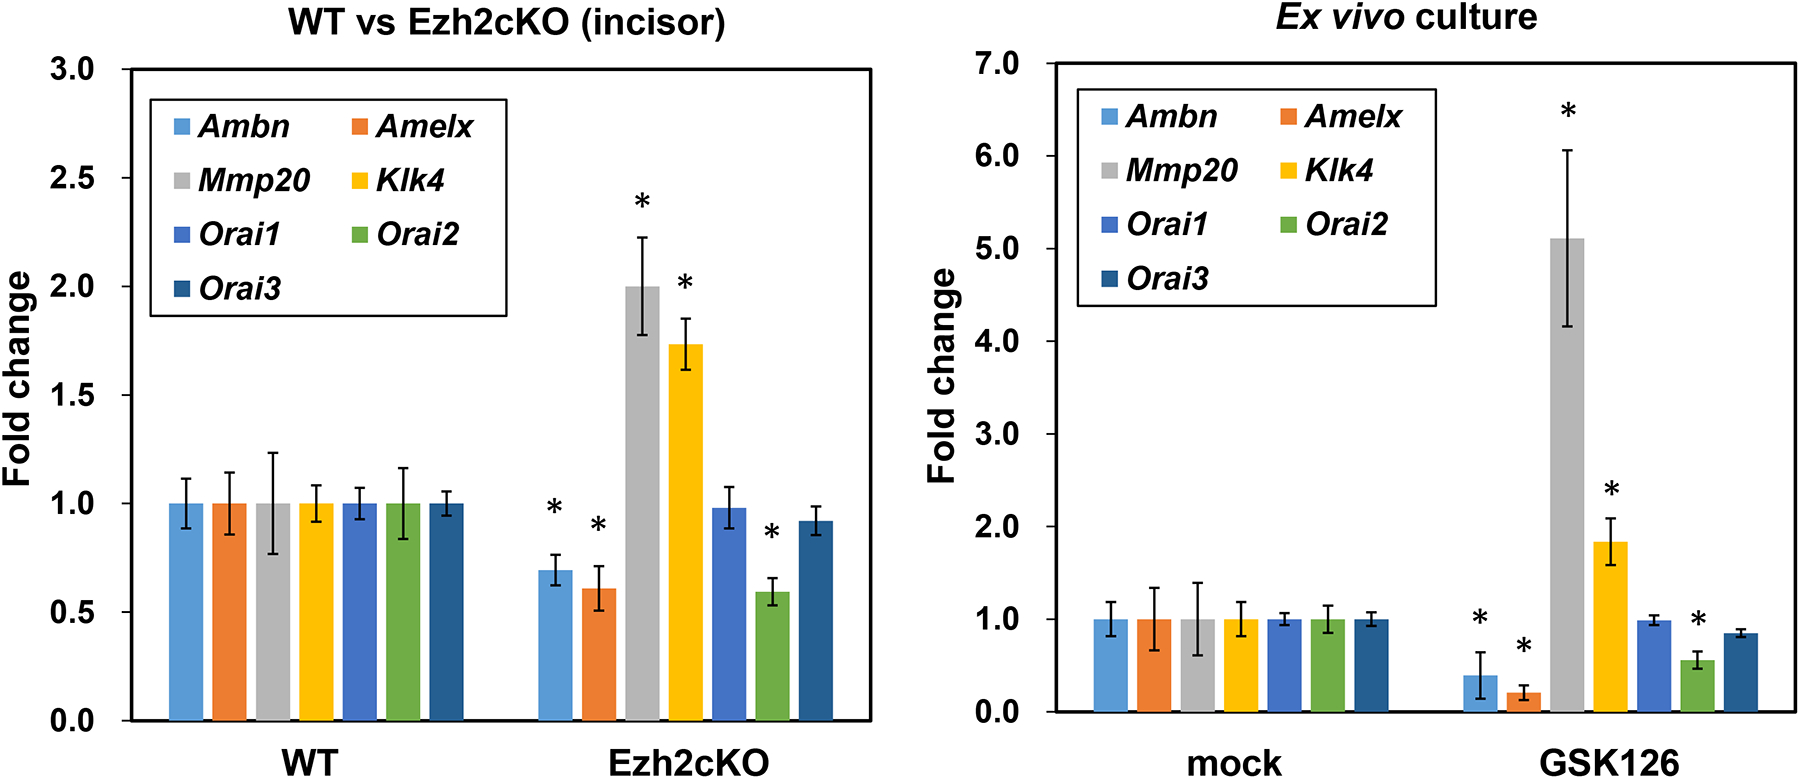
Fig. 3.

Profiling of ameloblast-related gene expression from WT or Ezh2cKO mice incisors (left) and from the ex vivo culture of ameloblasts with the surrounding tissues (right) using RT-qPCR. Each value was normalized to beta-actin level in the same sample. Each column shows the average from six samples. Error bars indicate standard errors of mean. *p < 0.05. Left: Total RNA from WT or Ezh2cKO mice incisors was isolated and the expression of indicated genes was analyzed. Right: Ameloblasts with the surrounding tissues from 7~10 days-old wild-type mice were cultured in DMEM/F12 media with or without 4 μM EZH2 inhibitor, GSK126. Total RNAs were isolated after 24 h.
