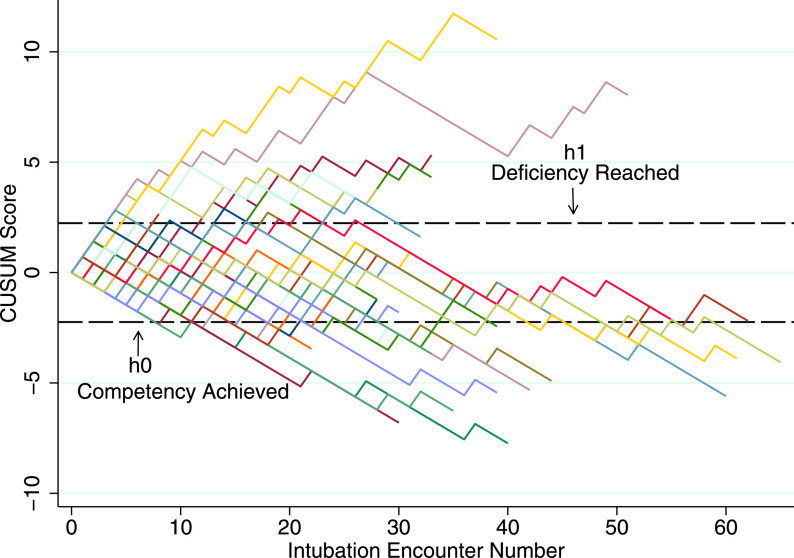
FIGURE 1.
CUSUM curve for tracheal intubation by NPM fellows. The lines demonstrate the learning curves of individual fellows, represented by different colors. The h1 and h0 lines demonstrate upper and lower control limits. Success is displayed as a decrease in CUSUM. A priori defined competency criteria was met if the fellow crossed h0, whereas deficiency occurred if the fellow crossed h1.

