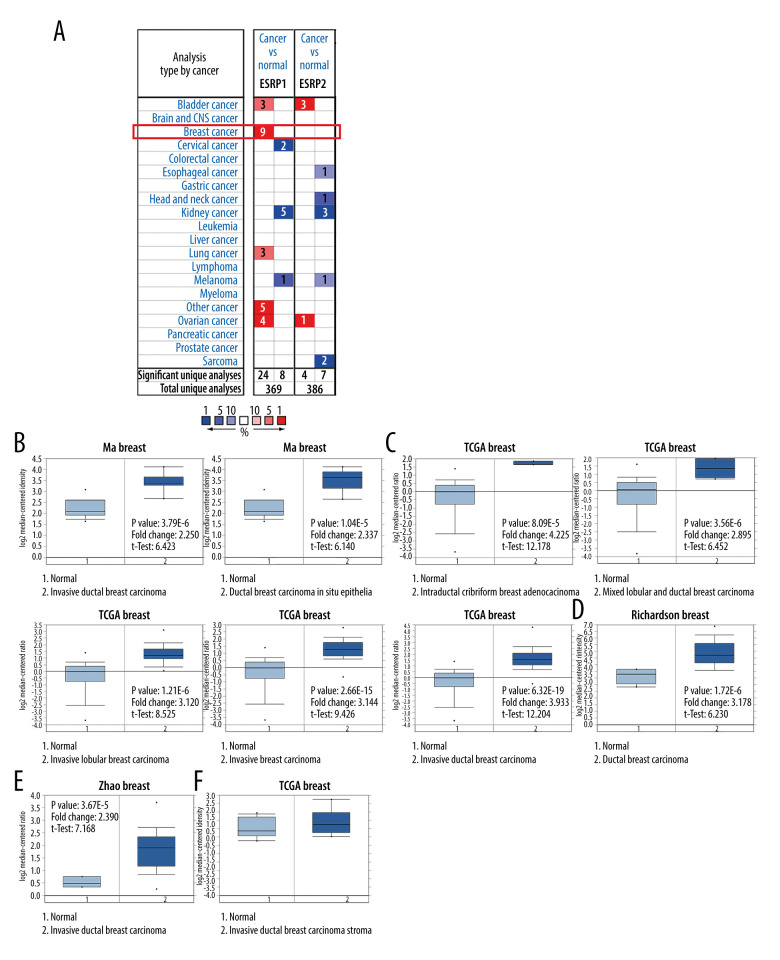
Figure 1.
The mRNA expression patterns of ESRP members in different types of cancer. (A) The figure shows the mRNA expression of a statistically significant target gene compared to a normal tissue sample in different types of cancer based on the Oncomine database (https://www.oncomine.org/resource/login.html). The threshold setting: P value, 1E-4; fold change, 2. The number in each cell indicated the number of datasets that met the requirements of this type of cancer analysis. The more data, the more valuable it is. Cell color is determined by the best gene rank percentile for the analyses within the cell. Red color indicates an increased mRNA expression of the gene and blue color refers to decreased mRNA expression of the gene. The gene rank was analyzed by percentile of target gene in the top of 10% of genes measured in every research. The mRNA expression of ESRP1 in (B) Ma Breast, (C) TCGA Breast, (D) Richardson Breast, and (E) Zhao Breast. (F) The mRNA expression of ESRP2 in breast cancer.

