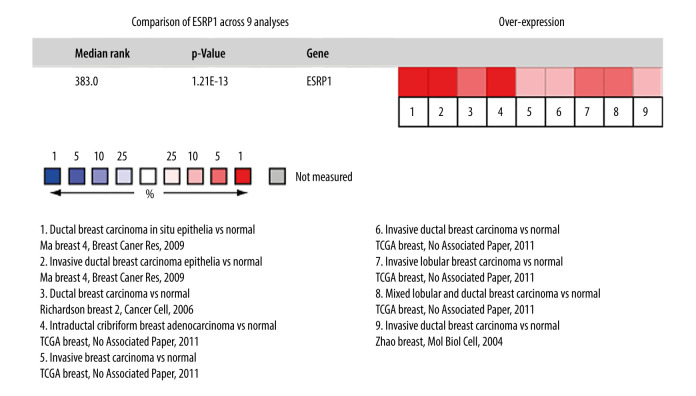
Figure 2.
Meta-analysis of ESRP1 expression profile in breast cancer. The Oncomine database was used for meta-analysis of the expression profile of ESRP1 in breast cancer. The threshold setting: P value, 1E-4; fold change, 2. The rank for a gene is the median rank for that gene across each of the analyses and is presented by a different color. The intensity of the color indicates the corresponding level of ESRP1 expression compared to that of normal tissue. Red indicates an increase in the expression level of ESRP1 mRNA, whereas blue indicates a downregulation.

