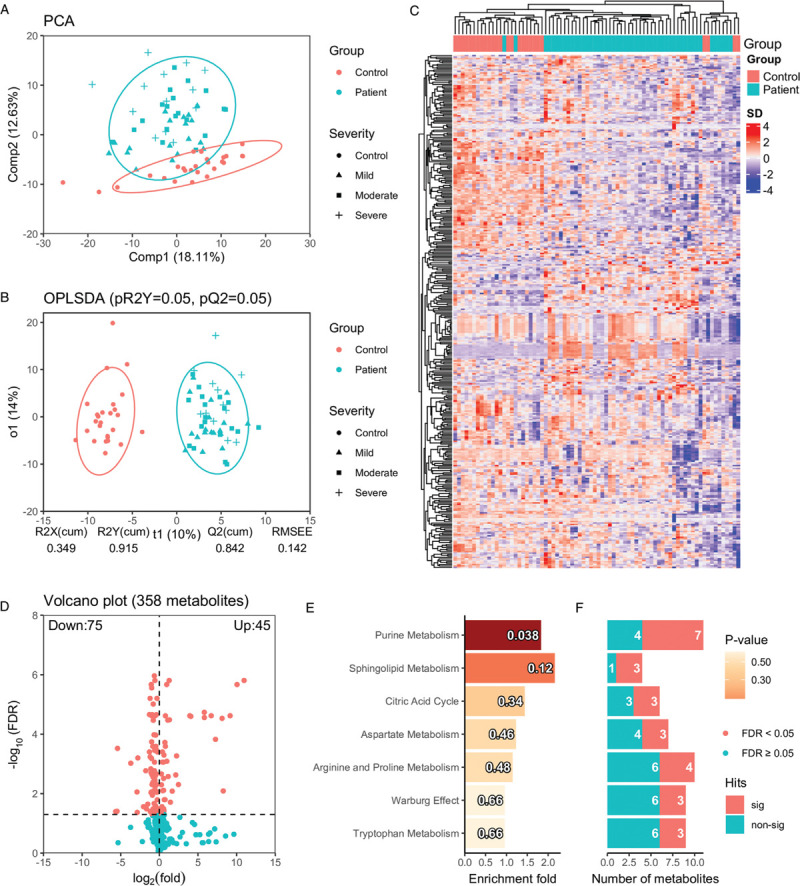
Figure 2.

Global metabolic perturbation in COVID-19 patients compared with healthy controls. (A) The principal component analysis shows the overall distribution pattern in plasma metabolites in healthy controls and COVID-19 patients. The first and second components from the principal component analysis explained 18.11% and 12.63% total variance. Concentration ellipses are at a 95% level based on a multivariate normal distribution. (B) The OPLSDA analysis shows the classification of healthy controls and COVID-19 patients based on the annotated metabolites, where predictive component (t1) and first orthogonal component (o1) explain 10% and 14% total variance in X (X: metabolomics data, Y: class label). pR2Y and pQ2 were derived from repeated permutations (20 times) with 5-fold cross-validation. (C) The hierarchical clustering analysis using all the annotated metabolites. (D) The volcano plot shows log2 fold change (based on original peak area) and FDR (cut-off at 0.05) based on Welch t-test P-values of the annotated metabolite. (E) The barplot shows the enrichment fold for metabolite sets with more than 2 hits in increasing order of P-value from top to bottom. The P-values are indicated in each bar. The numbers of identified metabolites in each metabolite set that are statistically significant (FDR < 0.05) and not significant are shown (F). COVID-19: coronavirus disease 2019; OPLSDA: orthogonal partial least square discriminant analysis; FDR: false discovery rate.
