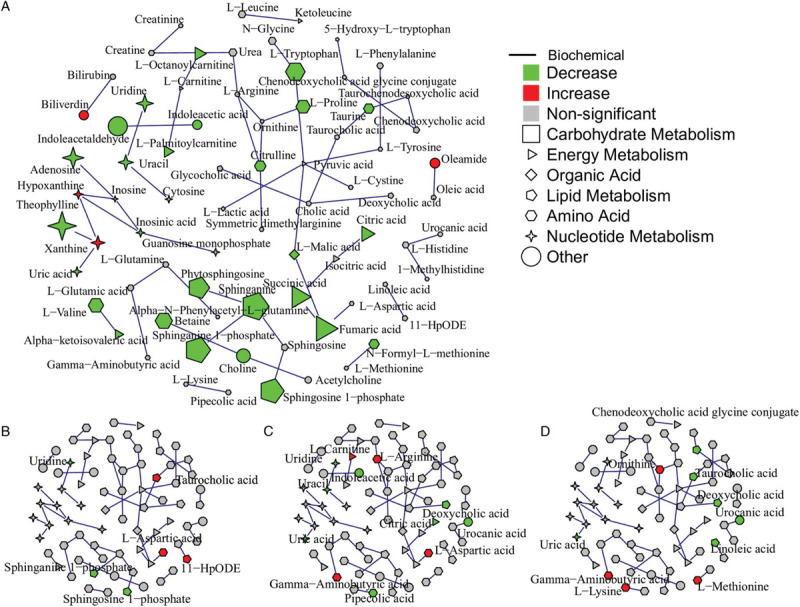
Figure 4.

Integration of metabolomics data and KEGG reaction information in an undirected network. Node shape indicates biochemical functions of the metabolite. Edges were generated based on KEGG RPAIR substrate-product reaction database. (A) Differential metabolites (FDR < 0.05) from the comparison of healthy controls and patients are mapped to the network. Node size indicates the absolute log fold change of the metabolites. (B) to (D) Differential metabolites (P < 0.05) from the comparison of mild and moderate patients, mild and severe, moderate and severe are mapped to the network, respectively.
