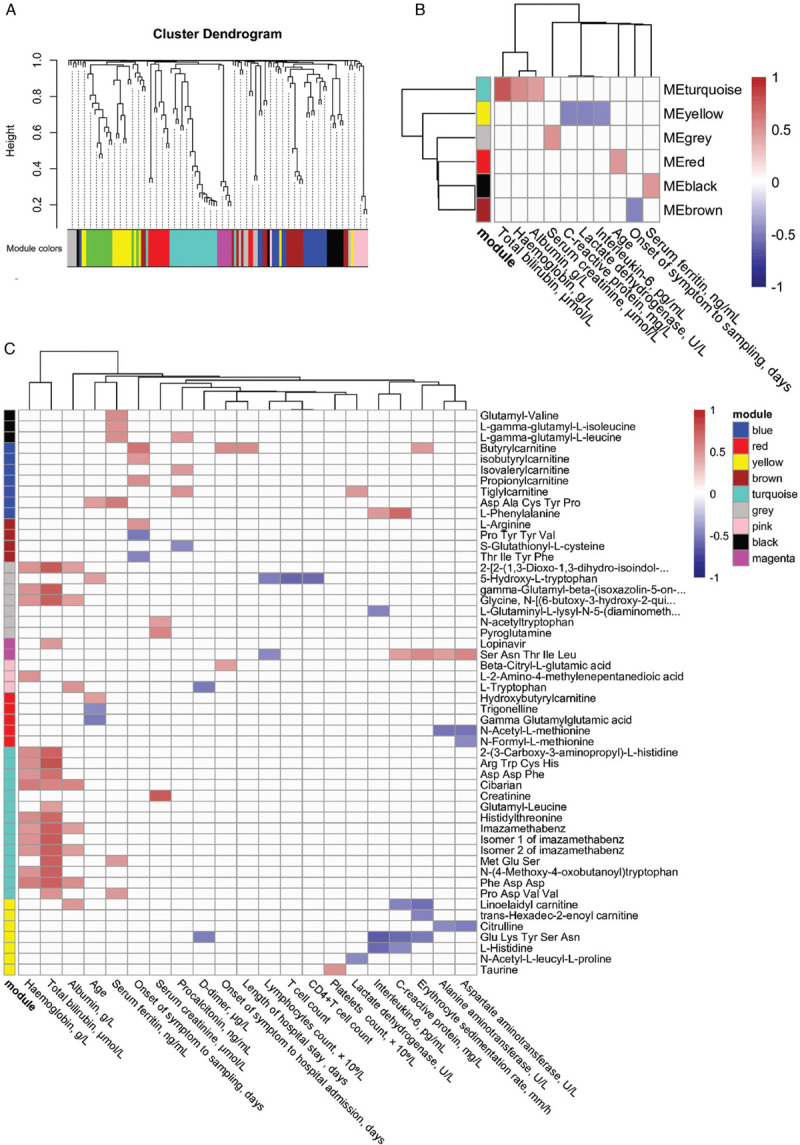
Figure 6.

Weighted correlation network analysis and correlation with clinical indices. (A) Metabolite dendrogram obtained by average linkage hierarchical clustering. The color strip below the dendrogram shows the corresponding module assignment. (B) Correlation heatmap shows Spearman correlation (FDR < 0.05) between module eigenvalues and clinical indices. (C) The correlation heatmap shows the Spearman correlation (FDR < 0.05) of the metabolites in each module and clinical indices. FDR: false discovery rate.
