Figure 7.

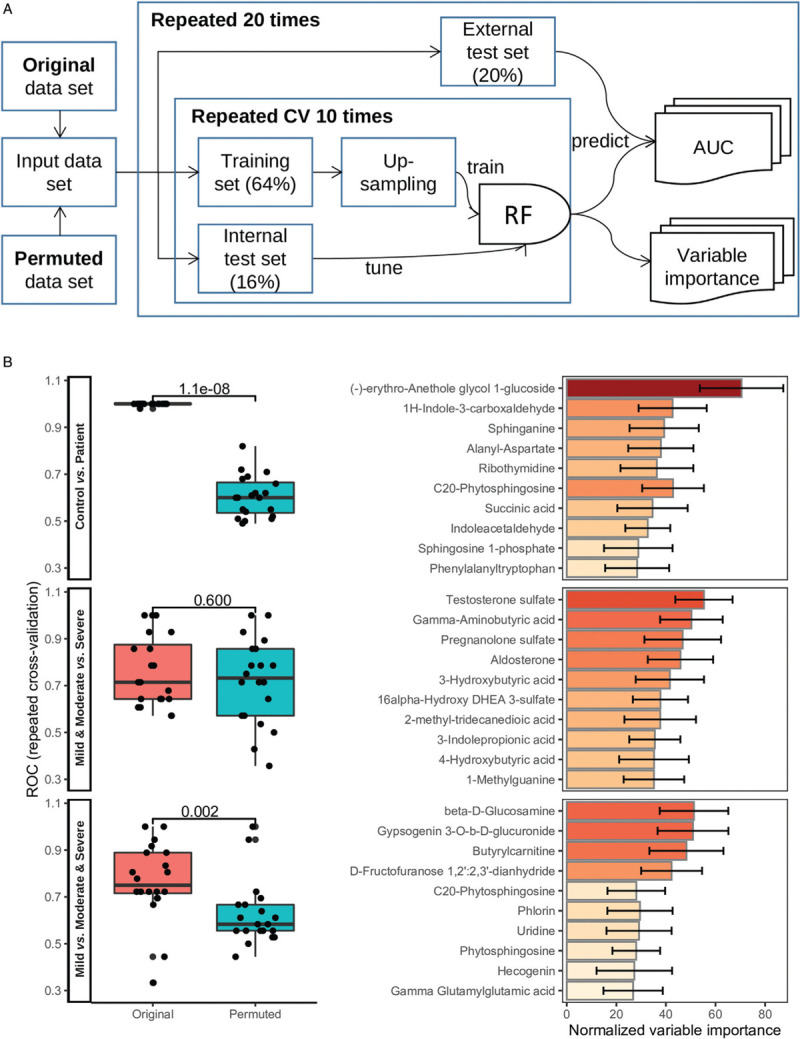
Discovery of potential metabolite biomarkers for COVID-19. (A) The schematic diagram shows the RF model training and validation workflow. (B) The boxplots show the area under the ROC based on the original and permuted data set in 20 repeated experiments, for the three models that classify controls against patients, mild and moderate against severe, and mild against moderate and severe, respectively. Mann-Whitney U test P values were indicated above the boxplot. The corresponding barplots show the normalized variable importance obtained from the RF models in the repeated experiments for the top 10 metabolites. COVID-19: coronavirus disease 2019; RF: random forest; ROC: receiver operating characteristic.
