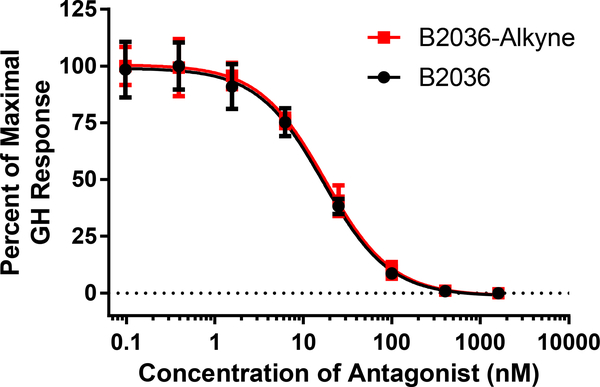
Figure 4.
Inhibitory bioactivity dose response curves of B2036 (black) and B2036-Alkyne (red) with IC50 values of 16.8 and 17.7 nM, with 95% confidence intervals (95% CI) of 14.4–19.6 and 15.5–20.2 nM, respectively, in Ba/F3-GHR cells. No significant difference in bioactivity was observed between B2036 and B2036-Alkyne following comparison by Student’s t-test (p > 0.05). Data is expressed as mean values with 95% CI of two individual experiments.

