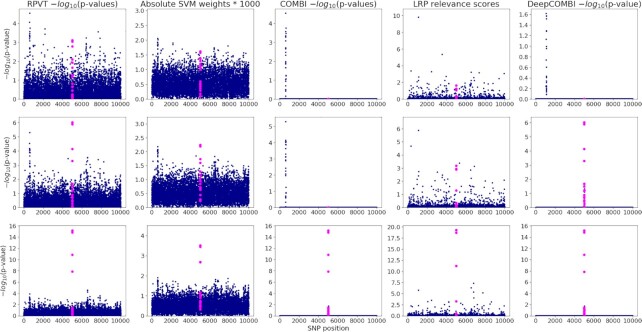
Figure 2.
Three exemplary generated datasets and the corresponding COMBI and DeepCOMBI results. We present the results of three exemplary replications: one with weak (first row), one with medium (second row) and one with strong (third row) association of the 20 informative SNPs at position 5001–5020 (highlighted in all subfigures). Standard RPVT P-values are plotted in the first column of subfigures. Absolute SVM weights and corresponding P-values of the COMBI method are shown in the second and third columns. Finally, LRP relevance scores and the corresponding P-values of DeepCOMBI are presented in the fourth and last column.

