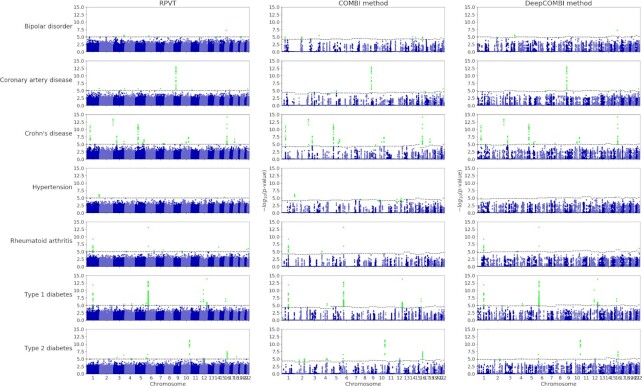
Figure 6.
Manhattan plots for WTCCC data. The negative logarithmic  test P-values are plotted against position on each chromosome for all seven diseases. Results from the standard RPVT approach, the COMBI method and the DeepCOMBI method are shown. Thresholds indicating statistical significance are represented by dashed horizontal lines and significant P-values are highlighted. Please note that the y-axes of all plots have the same limits (0–15) to enable direct comparison.

