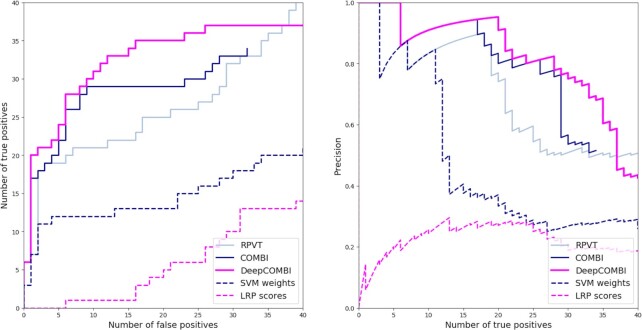
Figure 7.
ROC and PR curves of DeepCOMBI and all competitor methods on WTCCC datasets. Performance curves of all methods averaged over all diseases and chromosomes are shown. ROC curves are presented on the left and PR curves on the right side. Replicability according to the GWAS catalog was used for validation.

