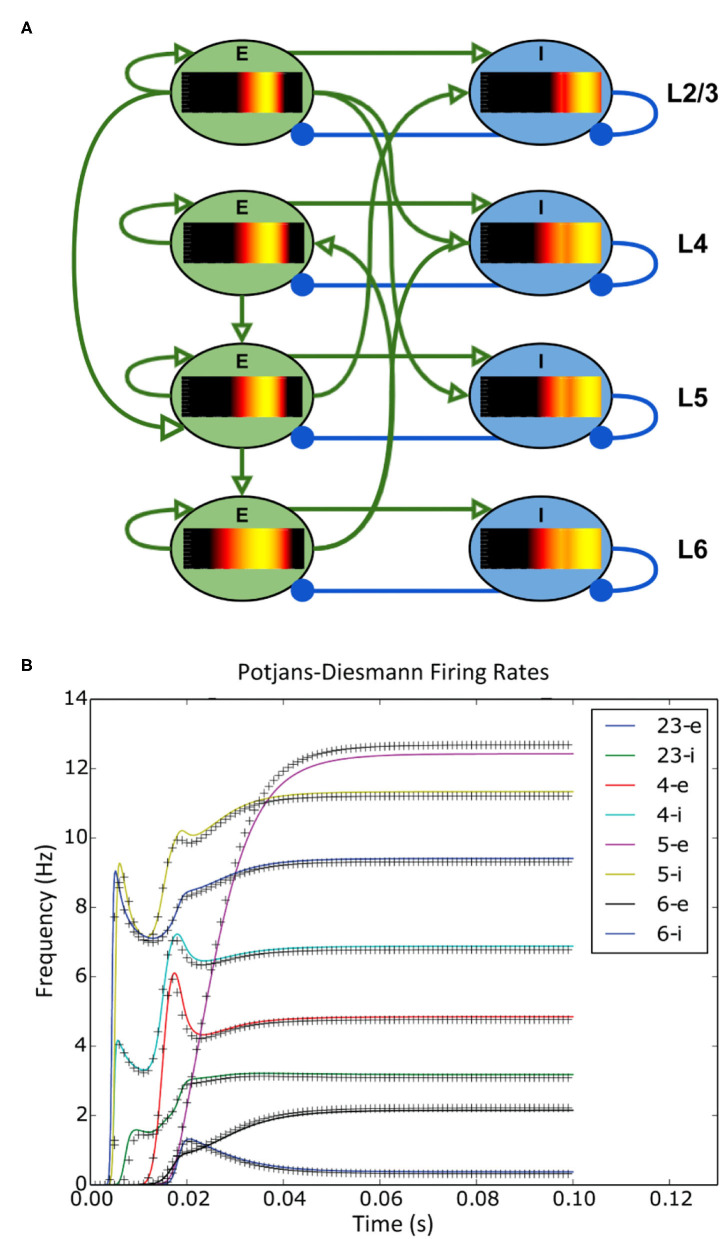
Figure 5.
(A) A representation of the connectivity between populations in the Potjans-Diesmann microcircuit model. Each population shows the probability density at an early point in the simulation before all populations have reached a steady state. All populations are of leaky-integrate-and-fire neurons and so the density plots show membrane potential in the horizontal axis. The vertical axis has no meaning (probability mass values are the same at all points along the vertical). (B) The firing rate outputs from MIIND (crosses) in comparison to those from DiPDE for the same model (solid lines).

