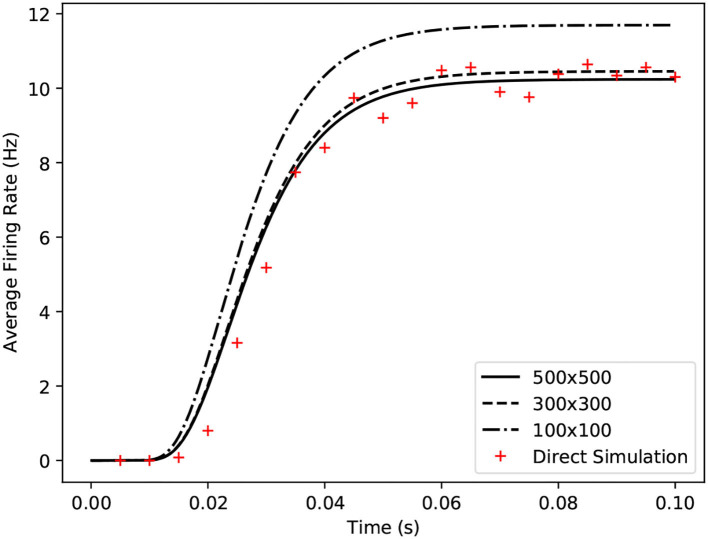
Figure 6.
Comparison of average firing rates from four simulations of a single population of conductance based neurons. The black solid and dashed lines indicate MIIND simulations using the grid algorithm with different grid resolutions. The red crosses show the average firing rate of a direct simulation of 10,000 neurons.

