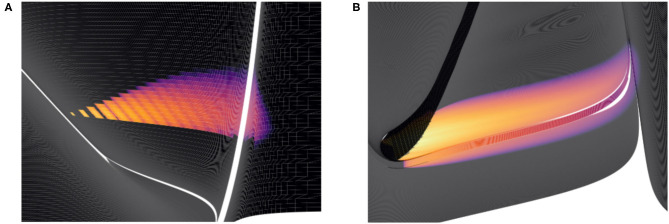
Figure 9.
Heat plots for the probability density functions of two populations in MIIND. Brightness (more yellow) indicates a higher probability mass. Scales have been omitted as the underlying neuron models are arbitrary. (A) When the Poisson master equation is solved, probability mass is pushed to the right (higher membrane potential) in discrete steps. As time passes, the discrete steps are smoothed out due to the movement of mass according to the deterministic dynamics (following the strip). (B) A combination of mass travelling along strips and being spread across the state space by noisy input produces the behaviour of the population.

