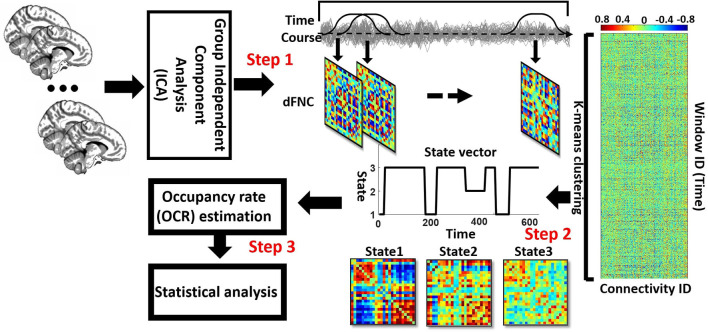
Figure 1.
Analytic pipeline: The time-course signal of 24 components of the CCN and DMN networks has been identified, using group-independent component analysis (ICA). In step 2, a taper sliding window was used to segment the time-course signals and then calculated the functional network connectivity (FNC). After vectorizing the FNC matrixes, we have concatenated them, and then k-means clustering, k = 3, was used to group FNCs into three distinct states (Step 2). Elbow criteria were used to find the optimal k. In addition, the L1 distance metric is used in this clustering. Then, based on the state vector of each subject, the occupancy rate or OCR features-in total, three features-were calculated from the state vector of each subject. Then we compared the OCR among the groups by using a ks-test. Then, we adjusted all p-values by the Benjamini-Hochberg false discovery rate (FDR) correction in each analysis (Step 3).

